May 1, 2018
by Mikhail Elyashberg, Leading Researcher, ACD/Labs
Busseihydroquinone F
The genus Pentas (Rubiaceae) can be found in tropical and subtropical Africa. There are around 40 species with a few of them also found in Saudi Arabia. As part of an ongoing search for new bioactive natural products from the genus Pentas, Abdissa et al [1] isolated three new naphthalenes from the roots of P. bussei including 2,2′-binaphthralenyl-1,1′-dione (1). The structure of this compound, named Busseihydroquinone F, was determined using 1D and 2D NMR spectra. We use these same spectra here to challenge ACD/Structure Elucidator.
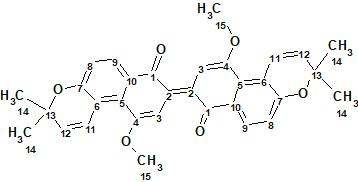
1
Compound 1 was isolated as a blue, amorphous solid. There were UV absorption bands (MeOH) at 214 252, 373, 486, and 572 nm. The HR-ESI-MS spectrum gave a protonated molecular ion at m/z 509.1983 [M + H]+ (calcd 509.1959) corresponding to the molecular formula C32H28O6. 1D and 2D NMR spectroscopic data are presented in Table 1.
Table 1. NMR spectroscopic data used for the elucidation of structure 1
| C Label | C | C calc | CHn | H | M, J | H to C HMBC |
| C 1 | 188.3 | 180.2 | C | |||
| C 2 | 130.8 | 137.11 | C | |||
| C 3 | 105.4 | 105.26 | CH | 8.4 | s | C 1, C 2, C 4, C 5 |
| C 4 | 158.7 | 151.72 | C | |||
| C 5 | 127.9 | 126.87 | C | |||
| C 6 | 116.6 | 119.510 | C | |||
| C 7 | 159.8 | 158.74 | C | |||
| C 8 | 117.8 | 120 | CH | 6.88 | d,8.5 | C 6, C 7, C 9 |
| C 9 | 130.4 | 129.34 | CH | 8.05 | d,8.5 | C 1, C 5, C 7 |
| C 10 | 126.7 | 132.26 | C | |||
| C 11 | 122.1 | 121 | CH | 7.46 | d,10.4 | C 7, C 13 |
| C 12 | 130.8 | 131.27 | CH | 5.72 | d,10.4 | C 6, C 13, C 14 |
| C 13 | 76.1 | 77.62 | C | |||
| C 14 | 28 | 27.02 | CH3 | 1.46 | s | C 2, C 13 |
| C 15 | 55.8 | 56.15 | CH3 | 4.03 | s | C 4 |
Comparison of the molecular formula (C32H28O6 ) with the number of signals observed in 13C NMR spectrum (15) shows clearly the presence of symmetry in the molecular structure.
The Molecular Connectivity Diagram (MCD) produced by the program and slightly edited (see below) in accordance with the characteristic NMR chemical shifts is shown in Figure 1.
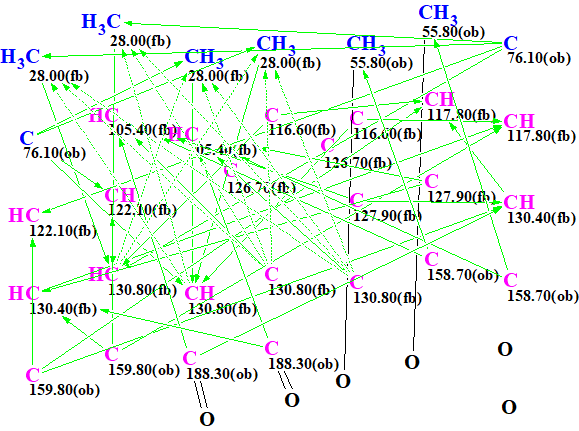
Figure 1. Molecular Connectivity Diagram (MCD)
MCD overview. As it has already been shown [2] the generation of symmetric structures from 2D NMR data is a challenge, and therefore it is desirable to utilize as many structural constraints as possible for speeding up the process. In this respect carbonyl fragments were defined for the carbon at 188.30 ppm and the methyl at 55.80 ppm was defined as a CH3-O group. In order to accommodate the symmetry of the problem each carbon chemical shift observed was set to correspond to 2 atoms. The carbon at 28 ppm was set to correspond to 4 atoms as it is evident from the 1D-1H spectrum and the HSQC that these are two equivalent methyl groups.
No contradictions in 2D NMR data were detected by the program, and strict structure generation was initiated. Results: k=4884 → 123 → 73, tg= 1 m 14 s.
The six top ranked structures of the output file are presented in Figure 2.
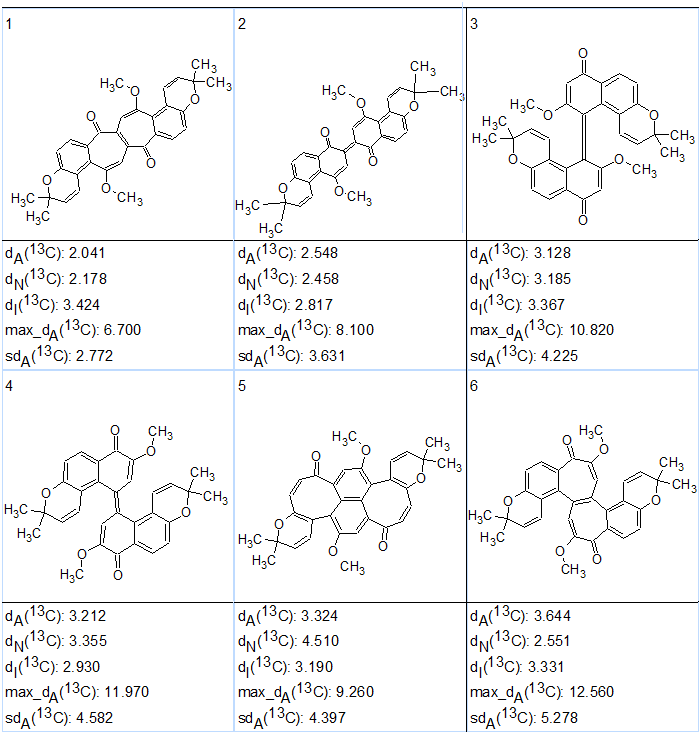
Figure 2. Six top ranked structures of the output file produced as a result of CASE analysis of busseihydroquinone F (1).
As seen in Figure 2 the ranking procedure did not place structure 1 at the top of the list, but in the second position. Because the calculated average chemical shift deviations for the first two structures were very similar, further structure verification using DFT chemical shift prediction was necessary. The corresponding calculations were performed by the authors of [3].
DFT calculations of the carbon chemical shifts of the six highest ranked isomers of busseihydroquinone F (1) predicted by CASE were done at the mPW1PW91/6-311+G(2d,p)//B3LYP/6-31+G(d,p) level of theory with inclusion of the polarizable continuum model for chloroform. The results are presented in Table 2. It turned out that the structure with the lowest RMSD and max_d of 2.20 and 4.41 ppm, respectively, was indeed structure 1 (#2 in Figure 2) which was proposed by Abdissa and co-workers[1] as the correct structure. Other structures suggested by CASE analysis had significantly higher values of RMSD and maximum deviations by DFT calculations.
| Carbons | Exp. | 1 | 2 | 3 | 4 | 5 | 6 |
| C 1 | 188.3 | 190.18 | 185.77 | 179.91 | 173.39 | 196.04 | 181.53 |
| C 2 | 130.8 | 134.79 | 126.39 | 137.98 | 139.82 | 135.58 | 133.38 |
| C 3 | 105.4 | 98.86 | 105.12 | 103.29 | 114.00 | 125.97 | 126.52 |
| C 4 | 158.7 | 156.46 | 161.27 | 163.64 | 150.57 | 152.64 | 155.74 |
| C 5 | 127.9 | 129.58 | 124.91 | 133.03 | 130.28 | 126.81 | 134.97 |
| C 6 | 116.6 | 116.70 | 115.91 | 124.16 | 118.91 | 105.71 | 119.23 |
| C 7 | 159.8 | 155.18 | 157.26 | 155.33 | 156.72 | 151.94 | 155.43 |
| C 8 | 117.8 | 117.02 | 116.09 | 117.99 | 115.52 | 125.59 | 116.16 |
| C 9 | 130.4 | 129.46 | 130.62 | 127.56 | 129.30 | 138.79 | 128.94 |
| C 10 | 126.7 | 134.03 | 124.41 | 122.15 | 124.59 | 132.72 | 135.78 |
| C 11 | 122.1 | 123.57 | 122.85 | 121.06 | 122.86 | 126.47 | 123.24 |
| C 12 | 130.8 | 128.06 | 131.00 | 131.23 | 130.01 | 122.61 | 129.33 |
| C 13 | 76.1 | 78.15 | 78.60 | 78.03 | 77.98 | 78.49 | 78.24 |
| C 14 | 28.0 | 24.73 | 25.22 | 26.97 | 26.79 | 24.20 | 25.17 |
| C 15 | 55.8 | 52.39 | 53.38 | 53.48 | 52.66 | 59.92 | 55.90 |
| RMSD, ppm | – | 3.40 | 2.20 | 4.34 | 5.57 | 7.97 | 6.56 |
| max_d, ppm | – | 7.33 | 4.41 | 8.39 | 14.91 | 20.57 | 21.12 |
a) Structure numbers correspond to the candidate structures shown in Figure 2.
Thus the proposed structure of busseihydroquinone F (1) is correct. It should be noted that authors [1] also calculated 13C chemical shifts to confirm structure 1. The DFT method, which was used by Abdissa and co-workers [1] , predicted carbon chemical shifts for structure 1 with RMSD of 6.09 ppm and max_d of 16.1 ppm. In general, it is expected that DFT methods should provide estimations of carbon chemical shifts for typical organic molecule with RMSD close to 2 ppm and max_d below 5 ppm. The relatively low accuracy of published chemical shift predictions [1] suggested that the re-evaluation of the proposed structure of busseihydroquinone F was appropriate.
Based on the improvement in the RMSD and max_d shown in Table 2, it can be concluded that the level of DFT theory that was used in [3] was more appropriate compared to that used in the original publication [1]. It is important to note, that researchers should be careful in the choice of DFT method for chemical shift calculations. Abdissa and co-workers [1] apparently used a method not optimized for NMR calculations. A better choice of well-established functionals and basis sets, such as those used in the current study, would be advisable for future study of such molecules as busseihydroquinone F (1).
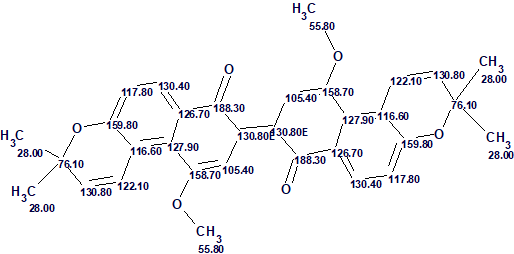
The structure of busseihydroquinone F with assigned 13C chemical shifts is shown below
The example shows that application of DFT based 13C chemical shift prediction for the verification of a problem solution allowed for distinguishing the correct structure in a situation when average chemical shift deviations calculated for the top ranked structures of the output file were rather similar.
References
- N. Abdissa, F. Pan, A. Gruhonjic, J. Grafenstein, P. A. Fitzpatrick, G. Landberg, K. Rissanen, A. Yenesew, M. Erdelyi. (2016). J. Nat. Prod., 79: 2181–2187. DOI:10.1021/acs.jnatprod.6b00178
- M .Elyashberg, K. Blinov, S. Molodtsov, Y. Smurnyy, A. Williams, T. Churanova. Computer-Assisted Methods for Molecular Structure Elucidation: Realizing Spectroscopist’s Dream. (2009). Journal of Cheminformatics, 1: 3. doi:10.1186/1758-2946-1-3
- A.V. Buevich, M. E. Elyashberg. (2018). Towards unbiased and more versatile NMR-based structure elucidation: A powerful combination of CASE algorithms and DFT calculations. Magn. Reson. Chem.. DOI: 10.1002/mrc.4645
About the Author