April 1, 2018
by Mikhail Elyashberg, Leading Researcher, ACD/Labs
Epoxyroussoenone
Honmura and co-workers [1] isolated two natural products epoxyroussoenone and epoxyroussoe-dione from a culture broth of Roussoella japanensis KT1651. Structures of the compounds were determined using 1D and 2D NMR spectroscopy supported by DFT calculations of 13C chemical shifts and ECD spectra. Comparison of experimental chemical shifts with theoretical values calculated at the EDF2/6-31G* level of theory and analysis of NOE data allowed authors[1] to identify the most plausible structures for each of the two isolated natural products. Their structures and absolute configurations were then confirmed by the ECD spectral analysis which was based on TD-DFT calculations at the BHandHLYP/TZVP level of theory. It turned out that employing X-ray analysis for further structure confirmations was impossible since the authors [1] were unable to obtain single crystals of sufficient quality.
In the present study, the NMR data set for epoxyroussoenone was used to further evaluate an approach [2,3] based on combined utilization of CASE [4,5] and DFT methods for structure elucidation and verification. Considering that the epoxyroussoenone is a proton-deficient molecule (C15H14O7), and experimental methods used for its structure elucidation were mainly based on heteronuclear proton-carbon correlations (HSQC, HMBC), it is somewhat surprising, that only two structural isomers of epoxyroussoenone, 1 and 2, were considered by authors [1].
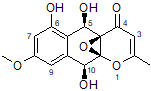
1
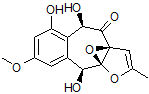
2
For each of the candidate structures, 1 and 2, four stereoisomers were produced and 13C and 1H chemical shifts were calculated for each by DFT methods in ref. [1]. These predictions, NOE data and ECD spectra analysis allowed the authors[1] to define structure 1 as the most probable geometrical and stereoisomer of epoxyroussoenone.
To verify this hypothesis, the molecular formula and spectroscopic NMR data (Table 1) for epoxyroussoenone [1] were entered into ACD/Structure Elucidator and a MCD was created by the program (Figure 1).
Table 1. NMR data for epoxyroussoenone (1)
| Label[a] | δC | δCcalc[b] | XHn | δH | J, Hz | HMBC (H to C) |
| C 1 | 170.26 | 171.99 | C | |||
| C 2 | 104.53 | 103.77 | CH | 5.62 | S | C 1, C 3, C 4, C 14 |
| C 3 | 189.12 | 189.16 | C | |||
| C 4 | 61.81 | 62.65 | C | |||
| C 5 | 65.09 | 68.09 | CH | 5.67 | S | C 6, C 7, C 11 |
| C 6 | 108.51 | 117.13 | C | |||
| C 7 | 158.39 | 160.6 | C | |||
| C 8 | 103.31 | 102.76 | CH | 6.49 | d(2.5) | C 6, C 7, C 9, C 10 |
| C 9 | 161.3 | 160.33 | C | |||
| C 10 | 104.7 | 106.19 | CH | 6.79 | d(2.5) | C 6, C 8, C 12 |
| C 11 | 134.58 | 140.72 | C | |||
| C 12 | 68.45 | 65.41 | CH | 5.17 | d(9.9) | C 6, C 11 |
| C 13 | 88.25 | 90.63 | C | |||
| C 14 | 21.05 | 21.65 | CH3 | 2.2 | S | C 1, C 2 |
| C 15 | 55.41 | 55.62 | CH3 | 3.79 | S | C 9 |
| O 1 | OH | 8.52 | Brs | C 6, C 7, C 8 | ||
| O 2 | OH | 4.62 | Brs | |||
| O 3 | OH | 2.53 | d(9.9) |
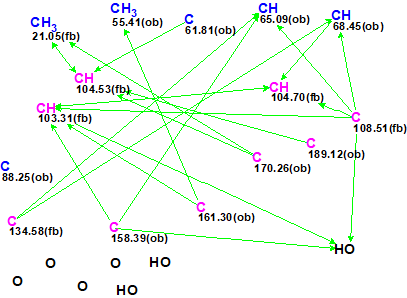
Figure 1. Molecular Connectivity Diagram for epoxyroussoenone (C15H14O7) based on HSQC and HMBC correlation spectra. Atom properties were set in accordance with author’s assumptions [1]. 1H Signal multiplicities were not included in the MCD input.
Strict Structure Generation for epoxyroussoenone accompanied with 13C chemical shift prediction by incremental approach took about 1 sec and produced 1500 structures. Only 26 structures passed spectral filtering (verifying structures for agreement with characteristic chemical shifts in 13C and 1H spectra) and the 4 ppm average deviation threshold. Eventually 13 candidate structures were stored for further analysis after removing the duplicates (k = 1500 → 26 → 13, tg = 1 s).
The 13C chemical shifts of the filtered structures were calculated using HOSE code and neural network-based approaches after which the structures were ranked in increasing order of dA values. As in the case of coniothyrione (see the Elucidation of the Month for March 2018), only six top-ranked structures for epoxyroussoenone, shown in Figure 2, were selected for further analysis.
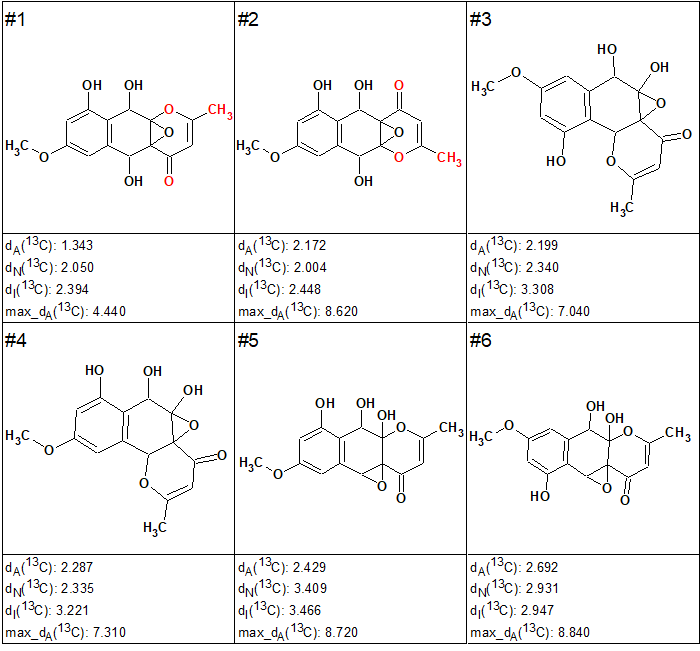
Figure 2. Top-ranked structures for epoxyroussoenone.
Interestingly, the CASE analysis showed that the correct structure 1 (#2) was again not the highest-ranking structure, while the alternative structure 2 was not even present among the final 13 structures. When structure generation was repeated without any structure filtering the following results were obtained: k=1500 → 816 → 382, tg = 1 s. It turned out that the candidate 2 occupied the 124th position in accordance with average deviation dA, while deviations calculated with all three empirical methods mentioned above are very large—6.5–7.5 ppm (see Figure 3)
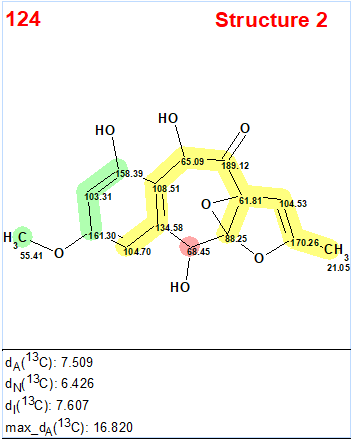
Figure 3. Candidate structure 2 for epoxyroussoenone which was placed on 124th position by the standard ranking procedure (in increasing order of dA values)! The color attributes of the 13C chemical shift prediction accuracy are: 3 ppm—green, between 3 and 15 ppm—yellow, greater than 15 ppm—red.
Note that structures #1 and #2 in Figure 2 are very similar. The difference between the two structures is in the relative orientation of the two large subunits separated by a proton-deficient region. The lack of more experimental NMR data, such as HMBC spectra recorded with different (lower) long-range coupling constants, which would likely differentiate one molecule from the other, necessitated the use of alternative methods. This example clearly shows that if structure elucidation of epoxyroussoenone was supported by CASE, the alternative structure 2 would have been rejected at earlier stages of analysis. Still, at least six plausible structural isomers would need to be examined.
Further differentiation of the six top-ranked structures of epoxyroussoenone was done by DFT calculations. As in the original work [1], four possible stereoisomers for each candidate structure notated with A, B, C, and D indices were considered (see Figure 4).
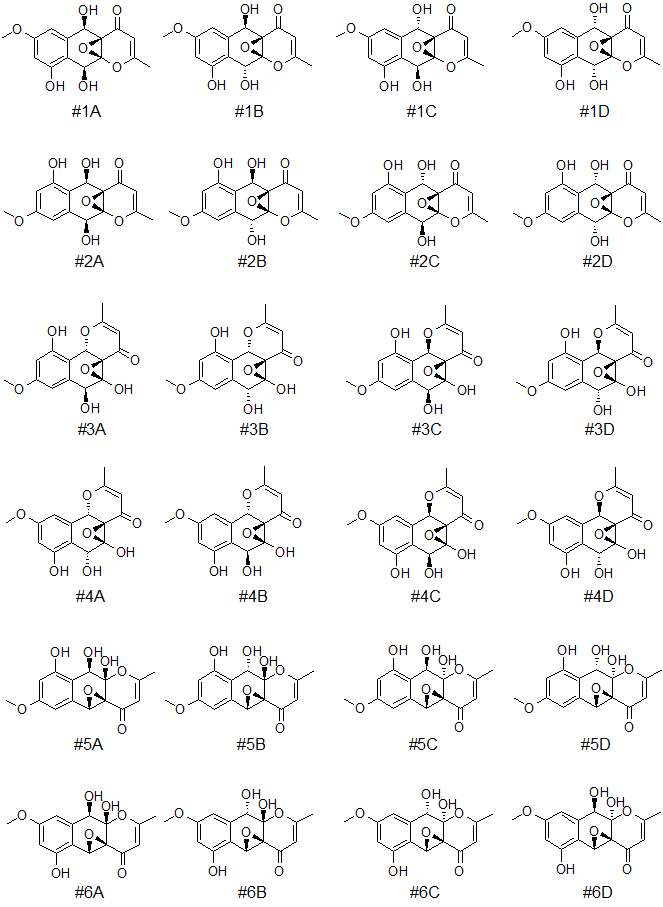
Figure 4. Six top-ranked candidates structures and their stereoisomers (notated with A, B, C, and D indices) for epoxyroussoenone.
Only the lowest energy conformations were considered in this study. The RMSD and maximum carbon chemical shift deviations (max_d) calculated by DFT for the six candidate structures for epoxyroussoenone are shown in Figure 5.
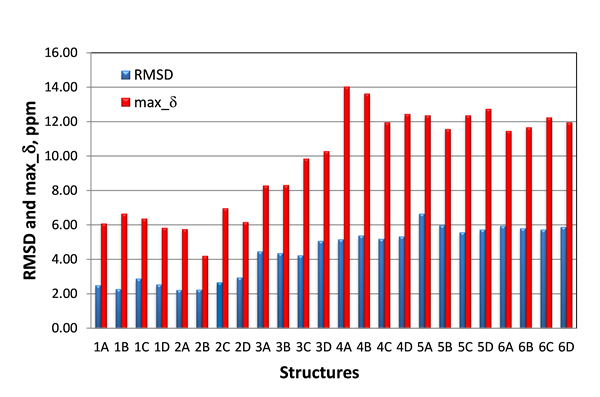
Figure 5. RMSD and max_d between experimental and DFT-calculated d(13C) for six top-candidate structures of epoxyroussoenone and their stereoisomers A, B, C and D (Figure 4).
As seen from Figure 5, the smallest RMSD (2.22 ppm) was indeed found for structure #2A, which is identical to structure 1 proposed by Honmura and co-workers [1]. Even though all stereoisomers of structures #3, #4, #5 and #6 can be easily excluded from further analysis due to the large RMSDs, the RMSD of the correct isomer, #2A, is only a fraction better than those of #1B and #2B, 2.27 and 2.24 ppm, respectively. Moreover, the smallest maximum deviation is also observed for structure #2B.
As noted above, structures #1 and #2 are very similar. Therefore, to distinguish one structure from the other, it is logical to focus only on those carbons (or other nuclei, such as protons, see below) that are more sensitive to the differences of the two types of structures. Such an approach allows the amplification of discrepancies between the structures that would otherwise be reduced by being averaged out in a complete set of calculated differences. Furthermore, when the comparison is done for relative differences of chemical shifts, it also helps to minimize systematic errors concomitant with chemical shift calculations.
Thus, in case of candidate structures #1 and #2 for epoxyroussoenone the largest difference between them is expected for carbons C5 and C10 situated in the central section of the molecule where the effect of the relative orientation of the two substructures (O1-C2-C3-C4-C5a-C10a and C6-C7-C8-C9-C9a-C6a) would be most noticeable. The same carbons are also associated with the two chiral centers and, therefore, they should help to distinguish stereoisomers #2A from #2B as well. In the Figure 6 the RMSD(C5,C10) calculated only for two carbons, C5 and C10, and relative differences between the C5 and C10 carbon chemical shifts (DDd(C5,C10)) for all stereoisomers of the six top-ranked candidates of epoxyroussoenone are shown. As is clear from Figure 6, the correct structure #2A (1) of epoxyroussoenone can be easily differentiated by the conspicuously smallest RMSD(C5,C10) and DDd(C5,C10) among all 24 candidates.
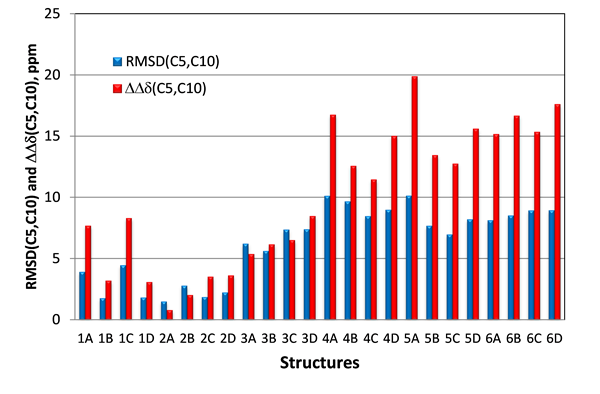
Figure 6. RMSD(C5,C10) and DDd(C5,C10) between experimental and those calculated by DFT for C5 and C10 carbons of epoxyroussoenone’s six top-ranked candidate structures and their stereoisomers A, B, C and D (Figure 4). DDd(C5,C10) = |(Dd(C5,C10)exp – Dd(C5,C10)calc|.
Another set of NMR parameters that was expected to be capable to differentiate structures #1 and #2, were the proton chemical shifts of the three hydroxy groups. In case of structures #2 the two hydroxy 5-OH, 6-OH and carbonyl-4 oxygen are likely interconnected via hydrogen bonds. This structural motif is conserved in all four stereoisomers of #2, whereas it is absent in structure #1. Instead, the hydrogen bond between the 10-OH hydroxy and the carbonyl-4 oxygen would be expected for structures #1. To verify this hypothesis, proton chemical shifts for the three hydroxy (5-OH, 6-OH and 10-OH) were calculated with DFT at the same level of theory as carbon chemical shifts. As seen in Figure 7, where RMSD(OH) and maximum chemical shift deviations for hydroxy protons 5-OH, 6-OH and 10-OH for all 24 studied isomers of epoxyroussoenone are shown, the lowest RMSD(OH) and max_d were indeed found for the correct structure #2A (1) and all stereoisomers of structure #1 had much higher RMSD(OH) and max_d than those of #2A (1).
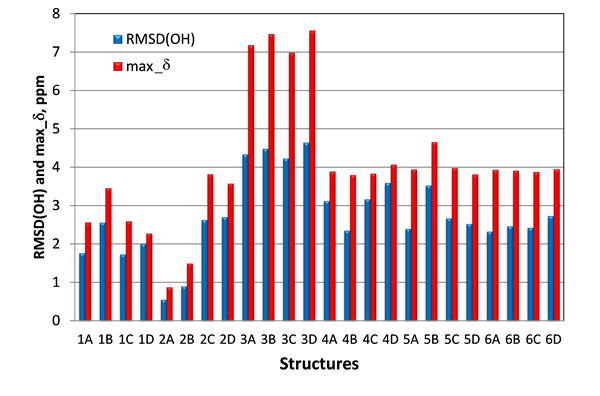
Figure 7. RMSD(OH) and max_d between experimental and calculated by DFT for 5-OH, 6-OH and 10-OH protons of epoxyroussoenone’s six top-ranked candidate structures and their stereoisomers A, B, C and D (Figure 4).
Again, we have shown that if the epoxyroussoenone structure elucidation was done or supplemented with CASE program results, the alternative structure, 2, would have been rejected in the early stages of data analysis. Importantly, the set of plausible structures delivered by CASE (13 structures) was much more diverse than those originally examined (two items)[1]. Nevertheless, the DFT calculations of d(13C) and d(1H) were able to determine the correct structural isomer with correct relative configuration.
Thus, we have demonstrated that the synergistic combination of CASE and DFT methods can serve as an unbiased, reliable, and efficient de novo structure elucidation method and can potentially be applied to those difficult situations when molecular systems are chiral, conformationally flexible and/or when other experimental methods (ADEQUATE, X-ray crystallography, etc.) would be difficult or impossible to use.
References
- Honmura, Y.; Takekawa, H.; Tanaka, K.; Maeda, H.; Nehira, T.; Hehre, W.; Hashimoto, M. (2015). Computation-Assisted Structural Elucidation of Epoxyroussoeone and Epoxyroussoedione Isolated from Roussoella japanensis KT1651. J. Nat. Prod., 78: 1505-1510.
- Buevich, A. V.; Elyashberg, M. E. (2016). Synergistic combination of CASE algorithms and DFT chemical shift predictions: a powerful approach for structure elucidation, verification and revision. J. Nat. Prod., 79(12): 3105–3116.
- Buevich, A. V.; Elyashberg, M. E. (2018). Towards unbiased and more versatile NMR-based structure elucidation: A powerful combination of CASE algorithms and DFT calculations. Magn. Reson. Chem. DOI: 10.1002/mrc.4645
- Elyashberg, M. E.; Williams, A. J.; Blinov, K. A. Contemporary Computer-Assisted Approaches to Molecular Structure Elucidation; RSC, Cambridge, 2012.
- Elyashberg, M. E.; Williams, A. J. Computer-based Structure Elucidation from Spectral Data. The Art of Solving Problems; Springer, Heidelberg, 2015.
About the Author