December 1, 2018
by Mikhail Elyashberg, Leading Researcher, ACD/Labs
Lancolide E
The first schinortriterpenoid (SNT) was isolated from Schisandra micrantha in 2003. The Schisandraceae family of plants, an important medicinal taxon, have since become famous for their ability to produce highly oxygenated and rearranged nortriterpenoids. This ability is thought to be coming from 3, 4-9, 10-disecocycloartanes, which show such terpenoid oxidation and cyclization reactions occurring in nature. This type of complex reactions generate a great structural variety, much more diverse than originally thought.
As a part of an ongoing research for SNTs from Schisandra micrantha, a minor SNT (1.3 mg) with a λmax at 204 nm featuring a complex tetracyclo[5.4.0.02,4.03,7]undecane-bridged system, termed lancolide E (1), was isolated by Shi et al [1].
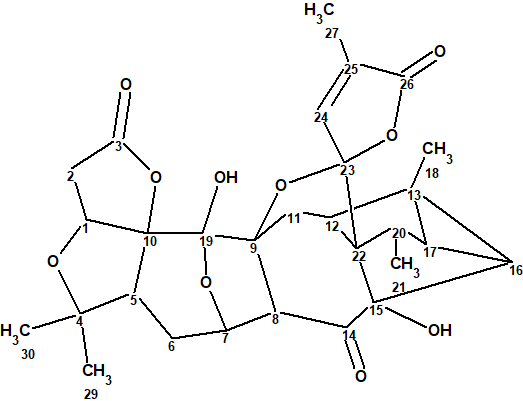
1
Its structure was determined, using 2D NMR spectroscopy, and confirmed both by DFT based NMR chemical shift prediction and X-ray diffraction analysis.
The experimental data presented in [1] were utilized for challenging ACD/Structure Elucidator.
Lancolide E was obtained as white amorphous powder. Its molecular formula was determined as C29H32O10 by the positive ESI-MS (m/z 563 [M + Na]+) and HR-EI-MS (m/z 540.1998 [M]+, calculated 540.1995), corresponding to 14 degrees of unsaturation.
NMR spectroscopic data (1D, HSQC, HMBC and COSY) are presented in Table 1. It is worthy to note that only key HMBC correlations were available from article [1]. Distinct 1H multiplicities are indicated in the column M of Table 1.
Table 1. NMR spectroscopic data for Lancolide E.
| Label | δC | δC clca | XHn | δH | M | COSY | H to C HMBC |
| C 1 | 80.500 | 79.290 | CH | 4.970 | u | 2.35 | C 4, C 10, C 19, C 3 |
| C 2 | 38.900 | 36.780 | CH2 | 2.350 | u | 4.97 | |
| C 2 | 38.900 | 36.780 | CH2 | 2.870 | u | ||
| C 3 | 177.200 | 175.130 | C | ||||
| C 4 | 87.500 | 86.230 | C | ||||
| C 5 | 47.400 | 43.320 | CH | 2.640 | u | 1.94 | |
| C 6 | 33.000 | 29.240 | CH2 | 1.990 | u | ||
| C 6 | 33.000 | 29.240 | CH2 | 1.940 | u | 2.64, 4.83 |
|
| C 7 | 70.200 | 69.980 | CH | 4.830 | u | 1.94, 4.23 |
C 5, C 9, C 19, C 14 |
| C 8 | 59.000 | 69.910 | CH | 4.230 | u | 4.83 | C 9, C 14 |
| C 9 | 85.300 | 89.280 | C | ||||
| C 10 | 97.800 | 96.760 | C | ||||
| C 11 | 25.500 | 31.930 | CH2 | 2.480 | u | 2.31 | C 22, C 9, C 19 |
| C 11 | 25.500 | 31.930 | CH2 | 1.280 | u | ||
| C 12 | 37.600 | 44.430 | CH | 2.310 | u | 2.48 | C 22, C 15, C 23 |
| C 13 | 27.200 | 33.010 | C | ||||
| C 14 | 204.300 | 208.740 | C | ||||
| C 15 | 91.100 | 84.870 | C | ||||
| C 16 | 27.000 | 34.410 | CH | 1.590 | u | 1.20 | C 22, C 15 |
| C 17 | 28.500 | 40.270 | CH | 1.200 | u | 1.59 | C 22, C 15 |
| C 18 | 13.900 | 19.600 | CH3 | 1.190 | s | C 16, C 13, C 17, C 12 |
|
| C 19 | 102.700 | 107.250 | C | ||||
| C 20 | 39.400 | 40.570 | CH | 2.670 | u | 1.04 | C 17, C 22, C 15 |
| C 21 | 15.600 | 17.840 | CH3 | 1.040 | d | 2.67 | C 17, C 22 |
| C 22 | 53.600 | 57.490 | C | ||||
| C 23 | 109.600 | 114.950 | C | ||||
| C 24 | 149.300 | 147.630 | CH | 7.280 | u | C 23, C 26 |
|
| C 25 | 129.400 | 131.860 | C | ||||
| C 26 | 171.500 | 171.690 | C | ||||
| C 27 | 10.300 | 10.700 | CH3 | 1.960 | s | C 25, C 24, C 26 |
|
| C 29 | 25.800 | 20.850 | CH3 | 1.250 | s | C 30, C 5, C 4 |
|
| C 30 | 30.400 | 26.950 | CH3 | 1.260 | s | C 5, C 4 |
|
| O 1 | OH | 4.390 | s | C 16, C 22, C 15, C 14 |
|||
| O 2 | OH | 6.250 | s | C 10, C 19 |
a C13 chemical shift prediction was performed by HOSE code based empirical method.
The data shown in Table 1 were entered into ACD/Structure Elucidator. The program created the Molecular Connectivity Diagram (MCD) shown in Figure 1.
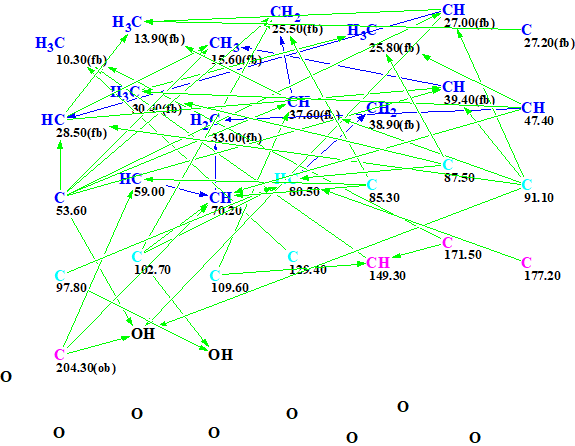
Figure 1. Initial molecular connectivity diagram.
MCD overview. The most specific peculiarity of this MCD is the presence of eight blue carbon atoms with 13C chemical shifts in a range between 80 and 129 ppm. A blue color is used to mark carbon atoms whose valence is ambiguous: either sp3 or sp2. Experience shows [2] that in this case we should expect a long structure generation time producing a large output file. To circumvent this we used several assumptions (“axioms”) based on characteristic NMR features: We suggested that atoms C 80.5, C 85.3 and 87.5 were in a state of sp3 hybridization and each of them was connected with at least one atom of oxygen, while atom C 129.4 is of sp2 type. The sp2-hybridized atoms C 171.5 and 177.2 can be assigned to ester carbonyl, and C 204.3 – to ketone. Multiplicities shown in the column M of Table 1 were used to characterize environments of corresponding carbon atoms. The edited MCD is shown in Figure 2.
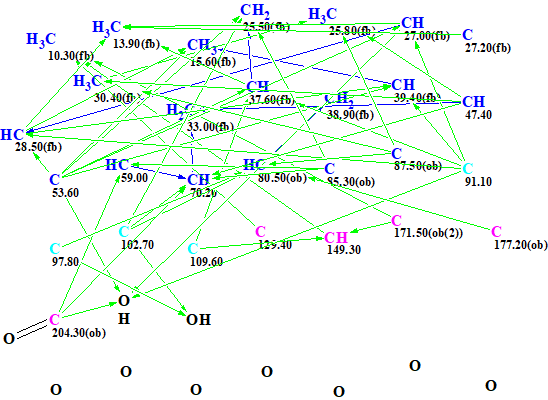
Figure 2. Edited MCD.
As all 2D NMR correlations presented in [1] were of standard length (2-3JCH,HH) the Strict Structure Generation option accompanied with 13C chemical shift prediction and spectral filtering was initiated. Only those structures which went through the filter were saved on the disc.
Results: k=9171→29⇒29, tg = 35 s. It is interesting to note that when a label “ob” (obligatory neighborhood with an heteroatom is obligatory) was removed from carbon atoms C 80.5, C 85.3 and 87.5, the following results were obtained: k = 31538→29→29, tg = 7 m 15 s. So manually defining a property evident to an expert for these atoms reduces the generation time by factor of 12.
13C NMR chemical shift prediction was performed for structures of the output file using three approaches common for ACD/Structure Elucidator (HOSE code based, neural networks and incremental). Additionally 1H chemical shifts were calculated by the neural networks algorithm. Finally, the structures were ranked in increasing order of dA(13C values – average deviations calculated by HOSE code based approach. The six top ranked structures of the output file are shown in Figure 3.
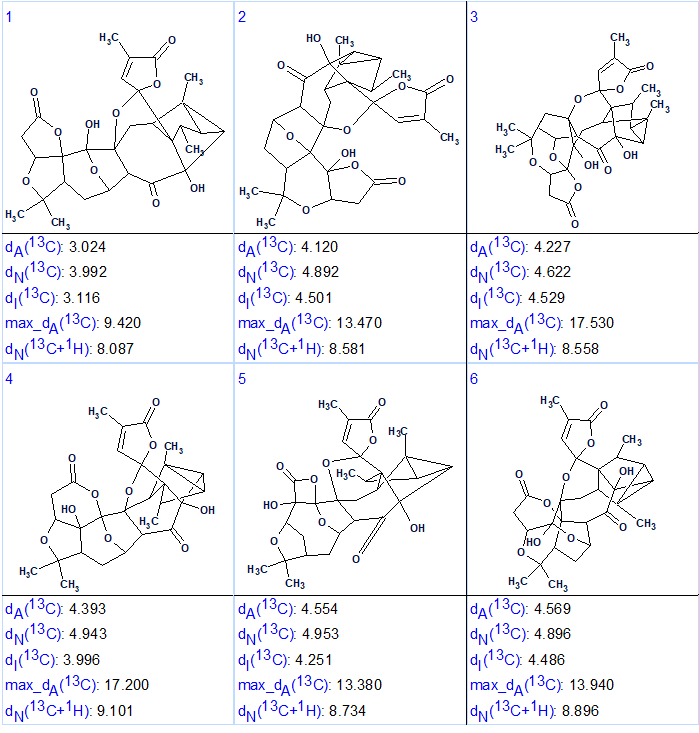
Figure 3. Six top ranked structures of the output file.
We see that structure #1 which is characterized by the smallest average deviations calculated using all three methods coincides with structure of Lancolide E (1) determined in article [1]. Maximum deviation max_dA(13C) and complex deviation dN(13C +1H) also point to structure #1. In the same time, values of minimum deviations found for the top structure #1 are relatively large, while the differences between deviations characteristic for structures #1 and #2 (1–1.5 ppm) are significant enough. The relatively large deviations are caused by a lack of appropriate structures in the database used for chemical shift prediction. As was shown by Buevich and Elyashberg [3-4], DFT calculations of 13C NMR chemical shifts for several top ranked structures are necessary to make a more confident choice. Taking into account the complexity of compound 1, authors [1] confirmed the lancolide E structure by QM calculations and X-ray diffraction analysis. Figure 4 shows results of regression analysis of experimental versus calculated 13C NMR chemical shifts computed by HOSE code approach and DFT methods.
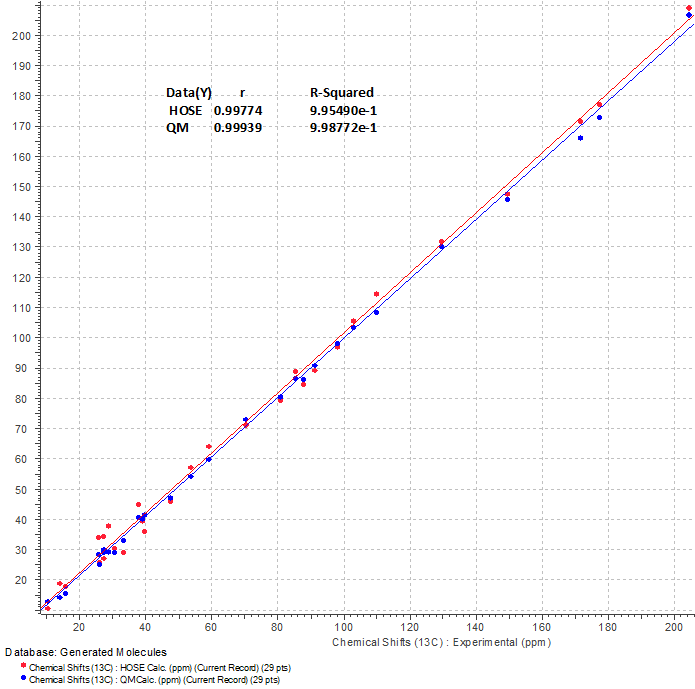
Figure 4. Regression analysis of experimental versus calculated 13C NMR chemical shifts of 1. Statistical parameters are shown in table.
We see that blue points (DFT predicted values) are a little closer to the blue regression line (R2=0.9987) than chemical shifts predicted by an empirical method (red points, red line, R2=0.9954). This example once more confirms the methodology of the two step selection of the most probable structure [3-4]: first, very fast (up to 30,000 shifts/s) calculations of NMR chemical shifts for the full output file using empirical methods and then, after structure ranking, second – DFT calculations for one or several top structures for more confidence of the best structure selection.
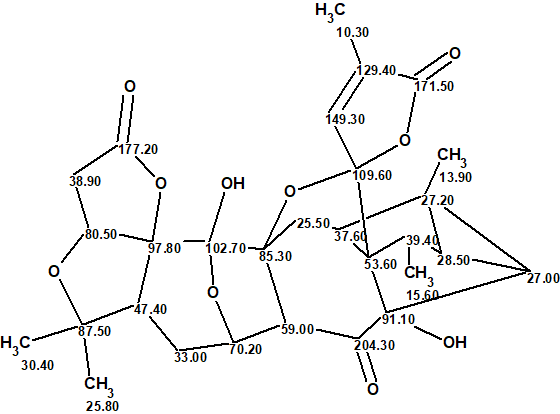
The most probable structure of lancolide E with 13C chemical shift assignment determined by ACD/Structure Elucidator is shown below.
References
- Y.-M. Shi, S.-L. Cai, X.-N. Li, M. Liu, S.-Z. Shang, Xue Du,W.-L. Xiao, J.-X. Pu, H.-D. Sun. (2016). LC−UV-Guided Isolation and Structure Determination of Lancolide E: A Nortriterpenoid with a Tetracyclo[5.4.0.02,4.03,7]undecane-Bridged System from a “Talented” Schisandra Plant, Org. Lett., 18 (1): 100–103.
- M. E. Elyashberg, A. J. Williams, Computer-based Structure Elucidation from Spectral Data. The Art of Solving Problems, Springer, Heidelberg, 2015.
- A.V. Buevich, M. E. Elyashberg. (2018). Towards unbiased and more versatile NMR-based structure elucidation: A powerful combination of CASE algorithms and DFT calculations. Magn. Reson. Chem., 56: 493–504.
- A.V. Buevich, M. E. Elyashberg. (2016). Synergistic combination of CASE algorithms and DFT chemical shift predictions: a powerful approach for structure elucidation, verification and revision. J. Nat. Prod., 79 (12): 3105–3116.
About the Author