July 1, 2020
by Mikhail Elyashberg, Leading Researcher, ACD/Labs
Lucidumone
Meroterpenoids are natural products containing a terpenoid and a non-terpenoid part. There have been many classes of such compounds isolated and characterized so far, from various natural sources, several of which have been found to have a wide range of biological activities. Meroterpenoids from various fungi usually show considerable biological activity and for this they have been studied from a pharmacological, synthetic, and biosynthetic point of view. Such an example are Ganoderma mushrooms, which are macrofungi known for containing many interesting meroterpenoids. Yan et al [1] carried out studies on G. lucidum from various origins, which led to the isolation and characterization of a pair of enantiomers of a novel meroterpenoid named lucidumone (1) possessing an unprecedented caged skeleton, comprising of a 6/5/6/6/5 polycyclic system.
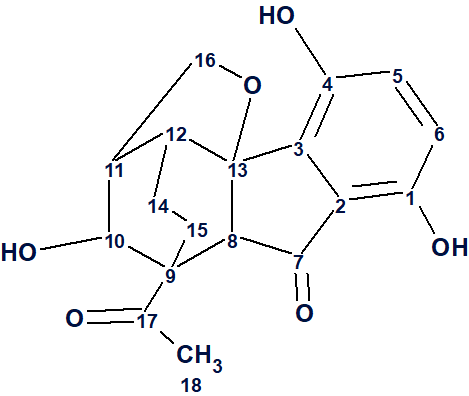
1
Lucidumone (1) was found to have the molecular formula C18H18O6 using HR-ESI-MS (m/z 331.1186 [M + H]+, calcd for 331.1176), which indicates the presence of 10 degrees of unsaturation. Its structure was determined using 1D and 2D NMR spectra (Table 1).
Table 1. NMR spectroscopic data acquired for Lucidumone.
| Label | δC | δC calc (HOSE) | CHn | δH | M | COSY | H to C HMBC |
| C 1 | 150.8 | 154.87 | C | ||||
| C 2 | 125.4 | 121.61 | C | ||||
| C 3 | 135.4 | 136.33 | C | ||||
| C 4 | 149.5 | 147.03 | C | ||||
| C 5 | 126.4 | 125.12 | CH | 7.01 | d | 6.75 | C 13, C 3, C 4, C 1 |
| C 6 | 118.6 | 118.62 | CH | 6.75 | d | 7.01 | C 2, C 4, C 1, C 7 |
| C 7 | 204.2 | 204.94 | C | ||||
| C 8 | 62.3 | 61.35 | CH | 2.88 | u | C 15, C 9, C 10, C 13, C 7, C 17 | |
| C 9 | 52.7 | 53.35 | C | ||||
| C 10 | 79.5 | 69.29 | CH | 3.9 | u | 2.35 | C 9, C 8, C 16, C 17 |
| C 11 | 48.7 | 43.22 | CH | 2.35 | u | 2.69, 3.90, 4.25 | C 12, C 9, C 10, C 13 |
| C 12 | 39.1 | 40.96 | CH | 2.69 | u | 1.86, 2.35 | C 13 |
| C 13 | 87.4 | 85.52 | C | ||||
| C 14 | 16.2 | 21.35 | CH2 | 1.06 | u | C 11 | |
| C 14 | 16.2 | 21.35 | CH2 | 1.86 | u | 2.17, 2.69 | |
| C 15 | 15.8 | 23.19 | CH2 | 1.33 | u | C 14, C 9, C 8, C 10 | |
| C 15 | 15.8 | 23.19 | CH2 | 2.17 | u | 1.86 | C 14, C 18, C 12, C 9, C 8 |
| C 16 | 74.3 | 71.32 | CH2 | 4.25 | u | 2.35 | C 11, C 10 |
| C 16 | 74.3 | 71.32 | CH2 | 3.77 | u | C 12, C 5, C 10, C 13 | |
| C 17 | 214.8 | 209.41 | C | ||||
| C 18 | 28.5 | 26.6 | CH3 | 2.26 | s | C 9, C 17 |
A Molecular Connectivity Diagram (MCD) created by ACD/Structure Elucidator Suite from the data shown in Table 1 is presented in Figure 1.
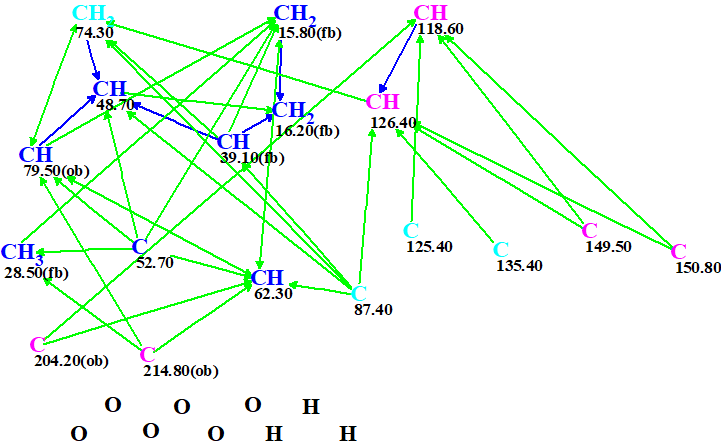
Figure 1. Molecular connectivity diagram.
No user edits of the MCD were made. Checking the MCD for consistency was completed by the program message which indicated that 2D NMR data contain contradictions and the minimal number of NSCs (nonstandard correlations – those for which nJ, n>3) is 2. Therefore, Fuzzy Structure Generation (FSG) accompanied with 13C chemical shift prediction and spectral filtering was initiated. The options of FSG were determined by the program automatically, which implied that the number of NSCs and their lengths (n values in nJ) are not constricted. Results: k = 1260 → (Filtering) → 19 → (removal of duplicates) → 11, tg = 25 s, and the program message informed us that four NSCs were detected and their lengths were determined during FSG.
13C chemical shift prediction was carried out for the output structural file using the three empirical methods implemented into Structure Elucidator. The four top structures ranked in increasing order of average deviations calculated using the HOSE code (dA) based approach are shown in Figure 2.
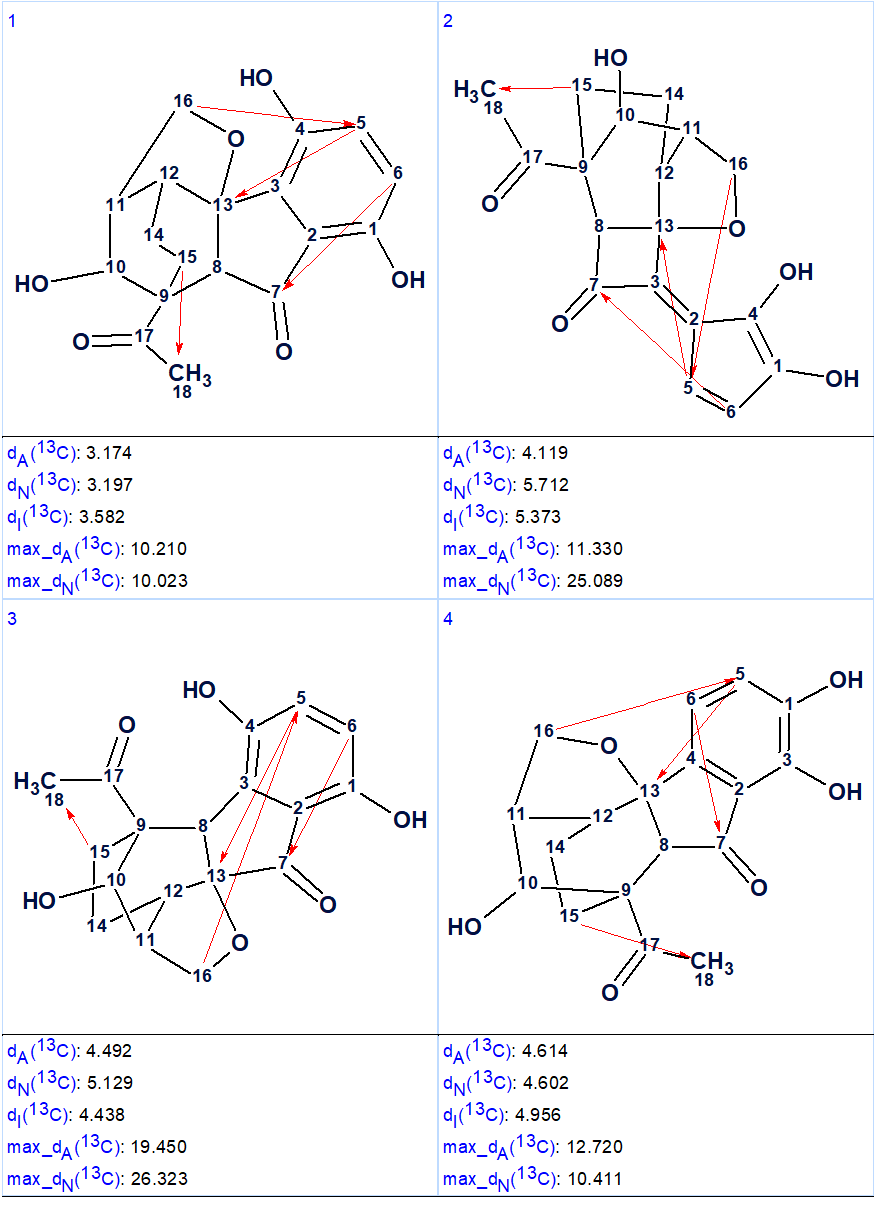
Figure 2. The four top ranked structures of the output file (first program run). Red arrows are used to mark NSCs.
Comparison of the first ranked structure with compound 1 shows that they are identical, that is the correct structure was determined by the program. Although all average deviations calculated for the structure #1 are relatively large, its validity is confirmed by the big values of average and maximum deviations found for the other structures. As it is seen in Table 1, the largest deviations were obtained for the atoms included into the left, “exotic” part of the molecule. However the presence of an improbably long connectivity [2] between carbon atoms C-16 and C-5 (n=6 for nJ) gave us a hint to check carefully the table of spectroscopic data presented in the article [1]. As a result, an error was detected in the data table. Its origin is in the habit of many authors to enumerate atoms in a molecule using designations which came from the 19th and early 20th century, for instance C-5, C-5′, C-5”, C-5”’, C-5a, etc. It is difficult to avoid errors when describing HMBC correlations in published tables using these designations. In the article [1], the atom numbering was made as shown below.
It turned out that the authors typed 3.77 → C-5 instead of 3.77→ C-5′, and as a result an extremely long correlation appeared during FSG. Interestingly the correct notation appears in the Supplemental Information tables accompanying the article. Note that even the presence of the error in the 2D NMR data does not prevent the program to elucidate the structure correctly. When the spectroscopic data were corrected, the FSG was repeated from the new MCD with the results:
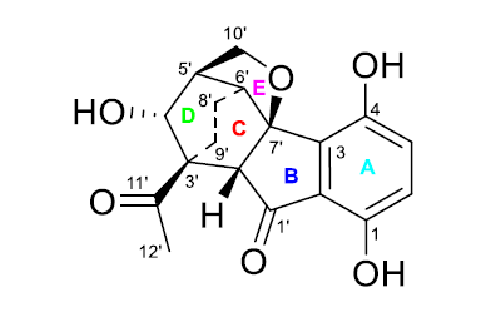
3278 → (filtering) → 30 → (removal of duplicates) → 11, tg = 33 s, and only 3 connectivities have been extended during structure generation this time. The four top structures of the ranked file obtained in the second program run are shown in Figure 3.
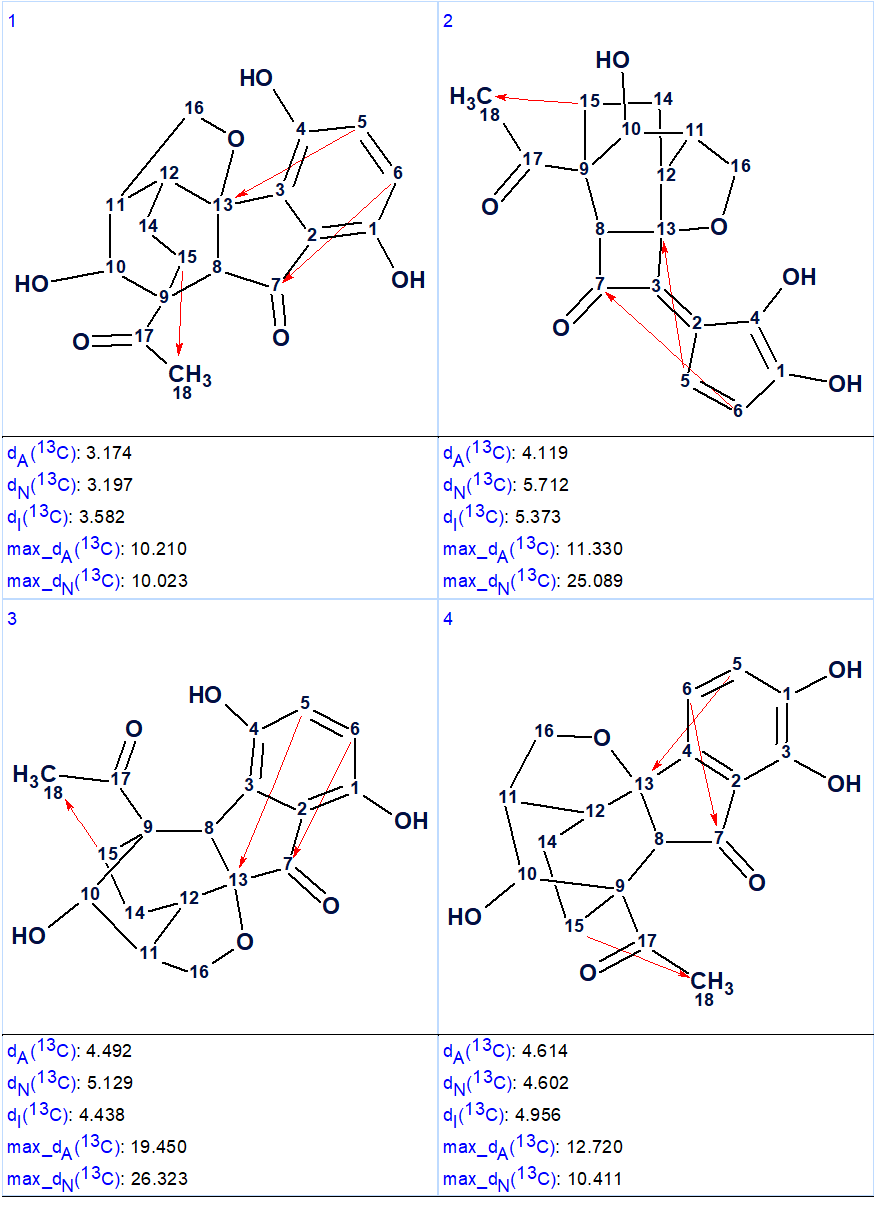
Figure 3. The four top structures of the ranked file (second program run).
Now structure #1 contains three NSCs corresponding to n =3 and all of them look possible [2]. The structure of lucidumone together with the 13C chemical shift assignments is shown below.
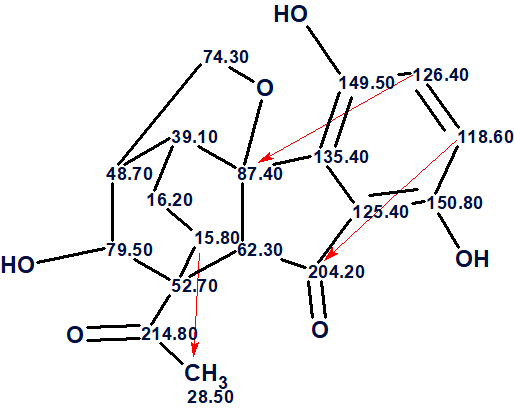
In conclusion, the structure of a molecule characterized by an unprecedented cage skeleton whose HMBC spectrum contained three latent nonstandard correlations was elucidated by Structure Elucidator in fully automatic mode. An error in the published table of spectroscopic data was revealed as part of solving the problem.
References
- Y.-M. Yan, H.-X. Zhang, H. Liu, Y. Wang, J.-B. Wu, Y.-P. Li, Y.-X. Cheng. (2019). (+/−)-Lucidumone, a COX-2 Inhibitory Caged Fungal Meroterpenoid from Ganoderma lucidum. Org. Lett., 21: 8523–8527.
- A.V. Buevich, M.E. Elyashberg. (2020). Enhancing Computer Assisted Structure Elucidation with DFT analysis of J-couplings. Magn. Reson. Chem., 58(6): 594–606. DOI: 10.1002/mrc.4996
About the Author