New Features and Updates in V2025
Version 2025 of ChemAnalytical Workbook Suite adds new features to ease signature verification and tracking of database records. Read below for details, and contact us for help upgrading your software.
Highlighted Features | Data Import & Export | Data Processing | Ease of Use | Spectrus Manager JS
Data Processing
As always, you can process data from various analytical techniques with ChemAnalytical Workbook. We’ve improved features for data processing, re-processing, and interpretation as well.
Processing NMR Data with ChemAnalytical Workbook
Data Analysis & Processing
Allow for Small Variations in the Integral Range of Peaks in External Standard qNMR
- You can now do external standard qNMR calculations using peaks whose integral ranges are not identical between replicates, which often occurs when working with manually defined integrals
New Parameters to Support Broader Workflows in External Standard qNMR
- You can now perform external standard qNMR calculations using replicate samples with different masses but constant volume with the help of:
- New parameters added to Concentration Calculation Tool and default report template
- Average w/w% (averaged across different replicates)
- w/w% RSD%
- Maximum Peak-to-Peak RSD% (intrasample)
- Mass and volume information included in the table of the Used Replicates popup menu
- New parameters added to Concentration Calculation Tool and default report template
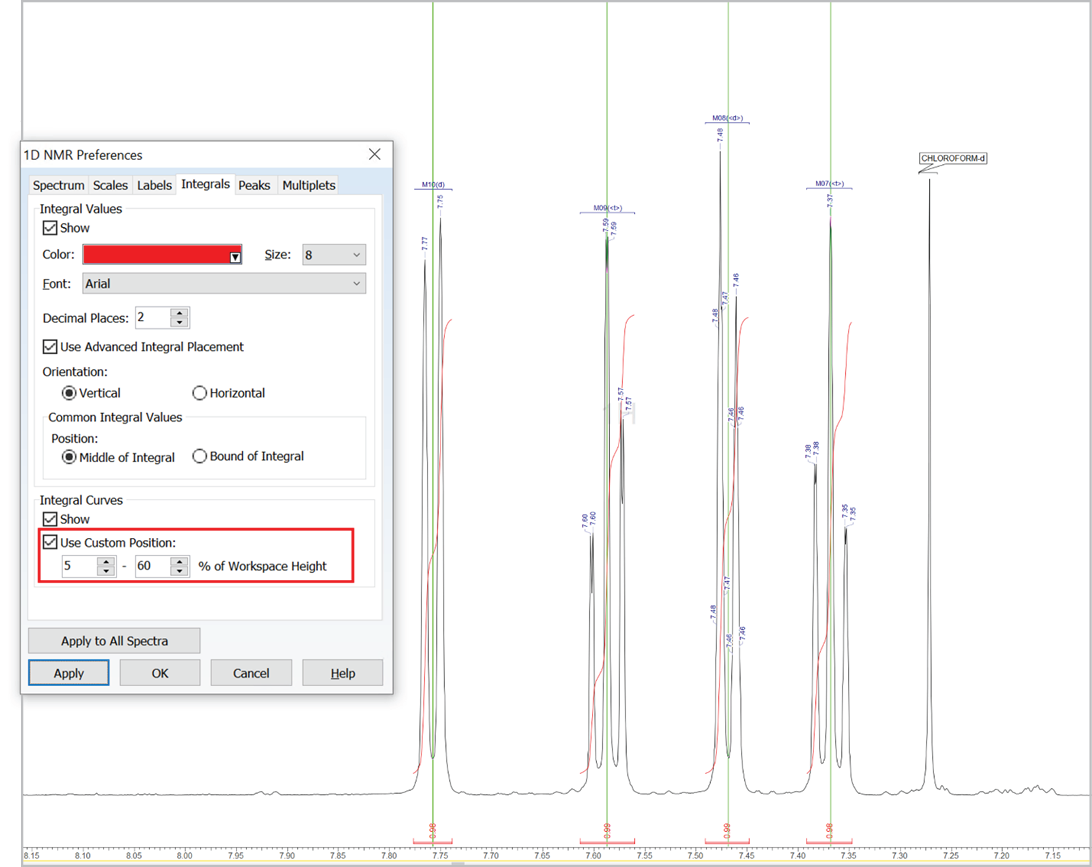
Customize the Position of Integral Curves
- You can now set a custom position for integral curves in the processing interface and reports by defining the desired vertical span of the highest curve in the displayed spectral region (as % relative to height of spectrum window, regardless of the vertical scale factor value)
Apply Unique Baseline Correction Parameters in Each Dimension of a 2D NMR Spectrum
- You can now apply baseline correction in each dimension of a 2D spectrum independently, allowing you to apply different parameters in each
Automatically Analyze Multiplets in 19F NMR Spectra
- You can now automatically analyze 19F spectra of structures with multiple fluorine atoms with an improved algorithm for better detection of first-order multiplet patterns
Improved Identification of Peaks Near Water in 1H NMR Spectra in DMSO
- You can now more accurately identify spectral peaks that appear at a similar position as the water peak in 1H spectra in deuterated DMSO (e.g., N-Me, O-Me, etc.) with an improved automatic analysis algorithm
User-Added Solvents/References Available to Macro Commands for NMR
- You can now utilize user-added solvents or references in macro commands by first invoking the new LoadSolventsTable macro command
Reporting
Optimize the Display of NMR Spectra in Reports
- You can now easily remove whitespace at the outer edges of frequency axes in 1D and 2D NMR spectra in reports. The new Auto Fit option in the Report Page Setup dialog box automatically selects a display region within ±0.5 ppm (¹H) or ±5 ppm (other nuclei) of the outermost peaks.
Summarize w/w% Values in qNMR Reports
- You can now include w/w% values for each replicate in the Sample Data table of a qNMR report
Processing MS & Chrom Data with ChemAnalytical Workbook
Data Analysis & Processing
Simplified Chromatogram Peak Detection
- Filter your picked peaks by setting a minimum area threshold (as a percentage of the total) and automatically integrate all peaks above this limit
Improved Visualization of Chromatogram Structures
- You can adjust the size of structures displayed on peaks to better visualize those of interest
Reporting
Display Intensity Values on MS Peaks
- You can now view detector and relative intensity values directly over mass spectral peaks for easier analysis
Improved Visualization of Structures on Chromatograms
- You now have the ability to display chemical structures more clearly on chromatographic peaks in your reports
Updated Default MS Reports
- You now have more control over MS reports with the ability to generate improved default mass spectra reports
Expanded Component Reporting Options
- You can now report component mass spectra by collision energy, and include component UV spectra, giving you a more complete view of your data
Improvements for Spectrus Manager JS
Spectrus Manager JS updates include new and improved search features to ease data accessibility, enhanced support for NMR data, and improvements to data analysis capabilities.
Highlighted Features
Search Across Schemas and Record Sets
- You can now simultaneously query data across various database schemas and record sets (previously limited to a single schema). Queries may include:
- Metadata
- Chemical structure, substructure, similar structures
- Spectra

Enhanced Features and Support for NMR Data
- You can now work with NMR Projects
- Push multiple NMR spectra into the processing interface for synchronized reprocessing or further interrogation of data
- Add NMR projects to record sets and retain the relationship between spectra.
- You can now initiate spectral searching that includes 2D NMR spectra and visualize the results
- You can now generate 1D NMR multiplet reports in various journal formats from a database record

- You now have greater flexibility and choice in labelling NMR spectra and more control over the display of captions
Visualize the Audit Trail
- You can now review the audit trail and download or copy/paste the information into third-party applications
Improved Features
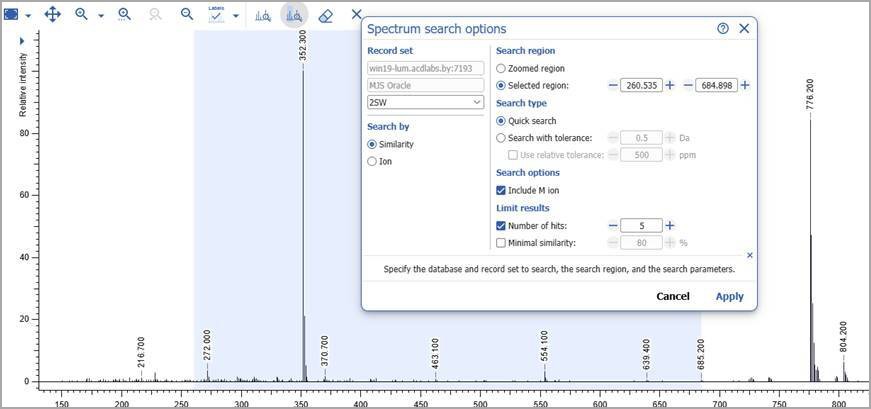
Initiate Spectral Search from the Processing Interface
- You can now initiate spectral search for MS data from the processing interface. Search by ion or spectral similarity.
Filter Table Data Within Columns
- You can now filter data in a table by the values within a particular column. Filter by:
- Date (later than, earlier than, date range, exists)
- Numbers and Ranges (equal to, more than, less than, in range, exists)
- String (includes, exact, contains word, exists)
Set Default Record Set on Login
- You now have the option to have a record set open by default when a user logs in to the application. This can be set by the User or Admin depending on permissions.
Greater Admin Control for Spectral Labels
- Admins can now set spectral label display parameters for all users. These may include:
- Spectrum type (1H NMR, MS1, etc.)
- Peak displays (e.g., chemical shift, RT, component name)
Open Search Results from Katalyst D2D and Luminata Record Sets in the Respective Application
- You now have the option to visualize search results from queries that return record sets from Katalyst D2D and Luminata, in those respective applications.
Data Import & Export
Export xC/UV/MS Traces as Flat Chromatograms
- You can now export xC/UV/MS traces as flat chromatograms for simplified downstream analysis or reporting
Features for Data Analysis
Spectrus Manager JS includes functionality for the processing, interpretation, and reporting of analytical data.
Processing Data with Spectrus Manager JS
Data Analysis & Processing
Assign Components to Individual Traces
- You now have the option to assign a component from the Components Table or Structure widget to multiple retention times across different xC/UV/MS traces
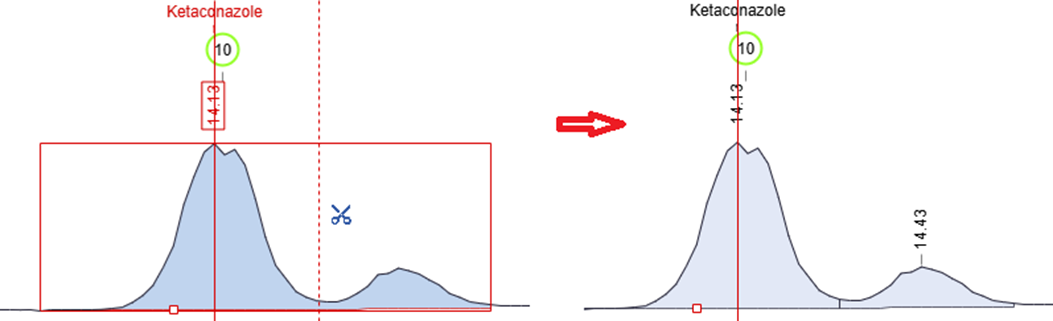
Manually Split Chromatographic Peaks
- You now have more control over peak integration with the ability to split chromatogram peaks manually using the scissors tool in manual integration mode
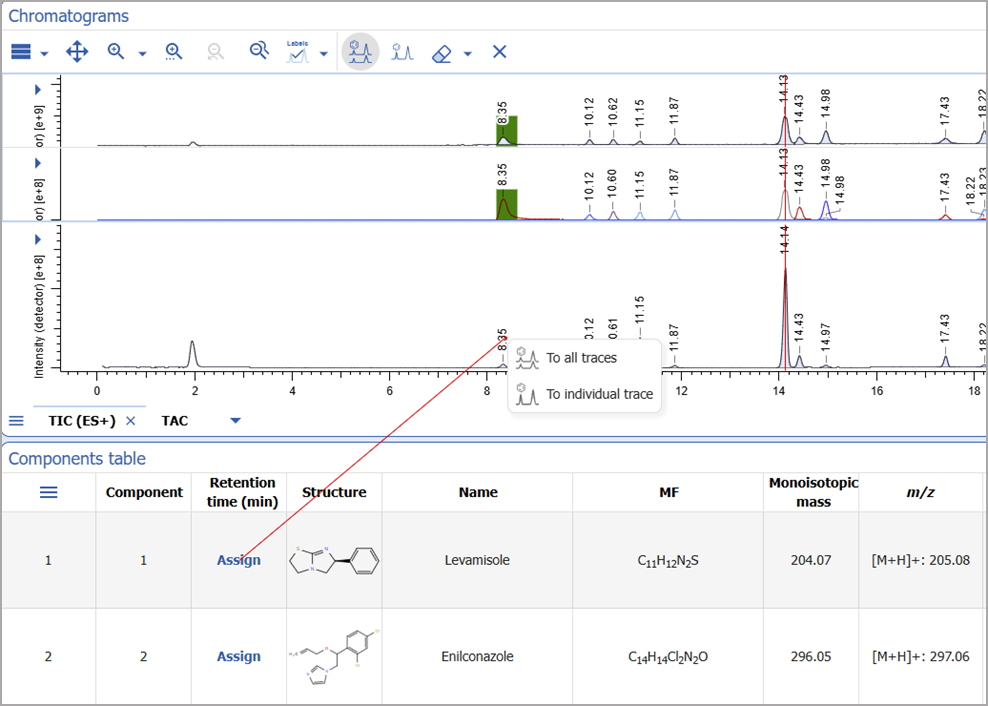
Manual Assignment from Chromatograms
- You can now use the assignment tool directly from the Chromatograms widget for more straightforward analysis
- You can start the assignment from a peak on the chromatogram and complete it in the Components table or Structure widget
- Assignments can be made to all traces or to individual traces based on the selected mode
Improved xC/UV/MS Profiles
- You now have more options for setting default pre-processing parameters for the following:
- Peak detection and integration
- Mass accuracy
- Component interpretation
Improvements to Annotations for Mass Spectra and Chromatograms
- You can now more easily view and interpret overlaid mass spectra and chromatograms
- View peak labels and annotations directly on overlaid mass spectra
- Display peak labels on chromatograms in overlay mode
- Review overlaid curves with an improved interface for scan-by-scan analysis of chromatographic and MSn spectra
- Navigate datasets more easily with a redesigned curve list in the overlay layout sidebar
Improved Baseline Correction for Extracted Peaks
- You can now adjust baselines for extracted peak in manual peak integration mode, giving you more precise control over integration
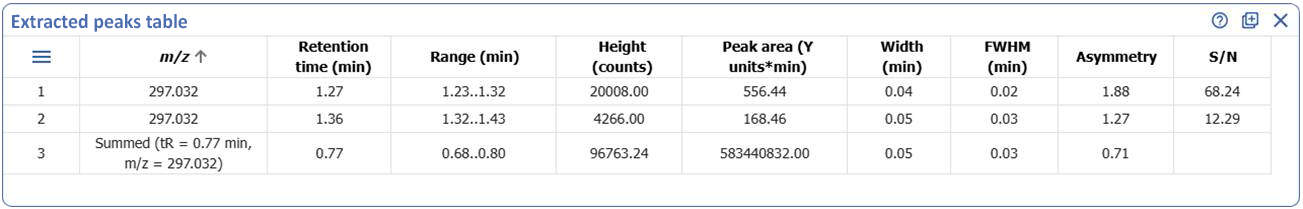
Tabulate Extracted Peaks for UV, MS, and Chromatograms
- The new ‘Extracted Peaks Table’ widget lets you clearly display and summarize peak data from individual extracted peaks directly within your dashboard
Reporting
Display MSn Component Spectra in Reports
- You now have the ability to add MSn component spectra in Pages for more comprehensive reporting
Add Extracted Peak Tables to Reports
- You can now include the new Extracted Peaks Table in both standard and template reports
- You can use the Legend to control which extracted peaks appear in the table
Ease of Use
- The eraser tool is now available for easy assignment removal of chromatographic peaks
- You now have the option to customize how MS match values are displayed:
- Optionally exclude fair match values from MS Match calculations
- Choose whether fair MS matches are displayed as color-coded in the Components table
- Control the appearance of assignment labels and previews on the chromatogram with new “color fair MS match” display options
- You can now add a new ‘Mass Values’ column to the Components table
- You now have the ability to view the XIC for any component in the Components table
Want to learn more?
Read more about the full features of ChemAnalytical Workbook, or contact us for help upgrading your software.