March 22, 2023
by Jesse Harris, Digital Marketing Coordinator, ACD/Labs
It can often feel like process chemists spend more time managing data than doing research. Modern laboratory instruments can generate massive amounts of data, which must be processed and compared to the results from other equipment and experiments before making decisions. It is a struggle to manage this flood of process chemistry data, but this can be controlled with the right tools.
Mathew Mulhern is a Principal Research Scientist at AbbVie, one of the largest pharmaceutical companies in the world. In a webinar hosted by ACD/Labs, he shared insights into the causes of data paralysis. This article summarizes his comments and shares his experience implementing a solution that helped AbbVie overcome these challenges.
A Deluge of Data—Managing Process Chemistry Data
One of the factors that is causing challenges for process chemists is the sheer volume of data they need to manage. Not long ago, scientists had to record data mainly using analog instruments—collecting temperature data would involve a mercury thermometer and writing in a paper notebook. This highly manual (and error-prone) workflow would limit the amount of data being generated. Over time, the mercury thermometers would be replaced by digital sensors, but scientists were often still responsible for collecting each data point.
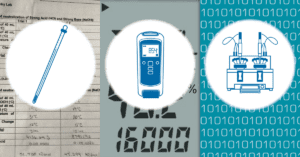
Today, process chemists often use laboratory reactors such as the Mettler-Toledo EasyMax to test their experimental conditions. “These reactors are gathering information from multiple probes, and they are doing that every 2 seconds,” said Mathew Mulhern. While this higher resolution can be useful, handling or analyzing this information becomes more challenging. “These data-rich experiments can very easily become data-paralyzing. We gather all this information and try to think of a use for it later.”
These large sets of online process data have limited use on their own—they must be combined and compared with offline data, such as HPLC results. Unfortunately, these two data types are incompatible and must be merged into a common data format. Excel spreadsheets have become the default tool for consolidating data because it is readily available, but it lacks many important features for pharmaceutical development, such as:
- Lacking chemical intelligence, meaning it is impossible to search by chemical structures
- Inability to read analytical files, meaning scientists must constantly export and manage CSV files, which is time-consuming
- Poor templating and duplication features, which are helpful for enabling consistent results and reducing error
While none of these barriers are insurmountable alone, together they make accessing and interrogating chemical data challenging, time-consuming, and frustrating. This is the cause of the data paralysis described by Mulhern.
The Need for Data Visualization in Process Chemistry
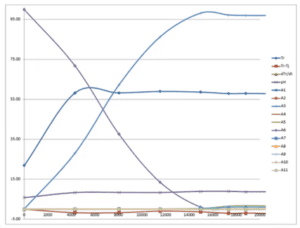
Once the process chemistry data is processed and consolidated, scientists use visualizations to interpret results. “Data visualization” may sound irrelevant for professional scientists, but consider analyzing temperature trends or a chromatogram by reviewing a table of numbers—it would be nearly impossible. Graphs and charts allow researchers to spot trends quickly, as well as excursions from those trends.
This is particularly important when attempting to understand the effect of process parameters on chemical reactions. “We can look at these parameters, and their impact on starting materials that are being consumed, products that are being formed, or impurities,” explained Mulhern. “Were those impurities throughout the course of the reaction, or did they only start to form after the main reaction was complete? That time course information is highly important in the pharmaceutical industry.”
Researchers often rely on Excel to generate these figures and graphs. The software cannot directly read analytical data, so results must be abstracted to tables of values. This means scientists are limited in their ability to interrogate results and must find the original analytical file to reprocess data.
Supporting Collaborative Science
These challenges become more complicated when you consider the structure of modern pharmaceutical development teams. Process chemists inherit methods and data from discovery or early-stage development. These teams may be divided across multiple labs, which could be thousands of kilometers apart. Many pharmaceutical companies also rely on contract organizations to support their research work. Each of these divisions creates obstacles to effective collaboration.
Individual scientists can use ELNs to review their results, but this isn’t possible when managing data for an entire research team. “Most of our chem ELNs don’t do a very good job of letting us compare results from one scientist to the next,” explained Mulhern. This direct comparison becomes nearly impossible if teams are using different ELNs.
Once again, the responsibility often falls to Excel to consolidate the work of these research teams. Files are shared back and forth to capture the progress of the project. This can lead to versioning issues, where scientists lose track of which file is the most current. Team leaders must monitor these Excel files and ensure they are kept up-to-date and managed correctly to avoid errors.
Implementing a CMC Data Management Solution for Process Chemistry
Mulhern’s team at AbbVie wanted to reduce their reliance on Excel spreadsheets and support better collaboration between their research teams. They implemented Luminata, a CMC decision support tool, that allowed them to consolidate all their chemical, process, and analytical data into a single interface. “That’s where the beauty of Luminata really comes into play—its that data accessibility, that ability to look at that single source of truth,” explained Mulhern.
“That’s where the beauty of Luminata really comes into play – its that data accessibility, that ability to look at that single source of truth.”
Mathew Mulhern, Principal Research Scientist, AbbVie
One feature that is particularly helpful for process chemists is the iControl tool, which integrates data from the Mettler-Toledo EasyMax into Luminata. Users can compare process parameters, such as temperature, pH, or pressure, with chromatography or mass spectroscopy results. The software also includes visualization tools, which allow scientists to see relationships between process conditions and performance.
Overall, Luminata has enhanced the ability of Mulhern’s team to manage their data effectively. Watch the webinar to learn more about how Luminata supports process development, including a demonstration of the iControl functionality.
About the Author
