Eduard Kolovanov,1 Alexander Proskura,1 Susanne Winiwarter2
1 Advanced Chemistry Development, Inc. (ACD/Labs), 8 King Street East, Toronto, ON, M5C 1B5, Canada
2 Drug Metabolism and Pharmacokinetics, Research and Early Development Cardiovascular, Renal and Metabolism (CVRM), BioPharmaceuticals R&D, AstraZeneca, Gothenburg, 431 83, Sweden
Introduction
In drug discovery, pKa is a key compound property that governs ionization, influencing molecular interactions and playing a critical role in potency, toxicity, and pharmacokinetics. During the early stages of compound design and discovery, researchers rely on predictive models, such as the ACD/Labs Percepta® software, which applies Hammett equations to estimate pKa values. However, at later stages, or when predictions are found to be less reliable for a specific compound class, pKa measurements are used to ensure accuracy.
To further enhance the precision of the ACD/Labs pKa prediction algorithm, we collaborated with AstraZeneca, leveraging over five years of their experimentally measured pKa data. This collaboration enabled us to refine our software, delivering even more precise and reliable estimations for drug development.
Methods
pKa values measured over a five-year period were extracted from AstraZeneca’s internal database, carefully reviewed for obvious errors, and then sent to ACD/Labs for further processing and algorithm training.

The data underwent additional scrutiny, with contradictory entries removed, and structural features identified for potential improvements. Using Hammett equations, which calculate pKa values based on structural fragments, the dataset was applied to further enhance prediction accuracy.
pKacalculated = pKa0 + ƒ(σI, σR, σmeta, σpara)
New fragments were generated from the dataset, leading to the development of new full Hammett equations or updated pKa₀ values where appropriate. These refinements resulted in noticeable prediction improvements for Data Set 1.
To further evaluate the model performance, an external test set (Data Set 2) was utilized, comprising of over 1,000 compounds with more than 2,200 experimentally determined pKa values, measured using UV-metric or pH-metric methods. Unlike Data Set 1, this dataset underwent minimal refinement, and no adjustments were made for tautomeric forms or pKa values.
Additionally, the similarity between compounds in the training and test sets were also not assessed. However, compounds with multiple inconsistent measurements were excluded to maintain data integrity.
Results
Data Cleaning Example
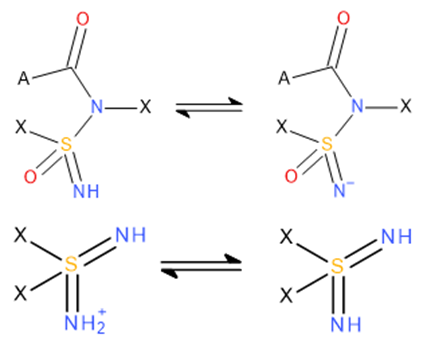
An essential step in data refinement was selecting the most appropriate tautomeric form to ensure accurate pKa predictions. Scheme 1 illustrates two examples where the tautomeric form on the left was not considered ionizable.

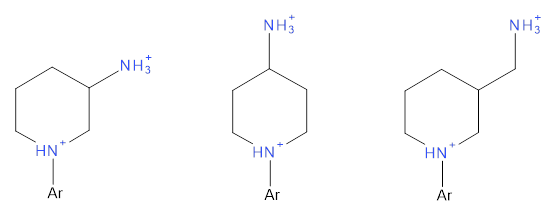
Additionally, contradictory data were identified and examined. Scheme 2 highlights examples of similar compounds with two amine groups within the same molecule. The pKa of the amine adjacent to the aryl group is influenced by its proximity to the primary amine, with a shorter distance typically resulting in a lower pKa value. However, this expected pattern was not always observed in experimental data, indicating a possible discrepancy.
Software Improvement
New pKa₀ values were specified for over 400 fragments, while for more than 70 fragments new or updated Hammett equations were defined. Additionally, two new dissociating centers were identified.
After training, pKa for 98.7% of compounds was predicted within 1 log unit, with 84.1% predicted within 0.5 log units. This compares to only 72% of compounds being predicted within 1 log unit, as well as numerous compounds being predicted beyond 2 log units accuracy before training. Thirteen ionization centers were not predicted at all by the old algorithm. Table 1 details the training results, showing the number of data points predicted within the specified limits based on pairwise comparisons of the closest values.
Table 1: Training result details of number of data points predicted within a limit.
| N<0.5 | N<1.0 | N<2.0 | N<3.0 | N<8.0 | N | |
| Before Training | 47.6% | 72.3% | 94.0% | 98.4% | 100% | 2249 |
| After Training | 84.1% | 98.7% | 100% | – | – | 2262 |
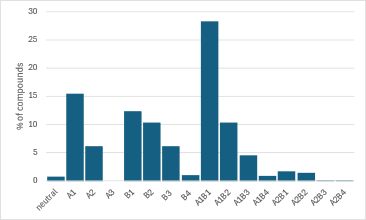
Calculation statistics for Data Set 1 are also presented on Figures 3a/b.


Predictions for Data Set 2
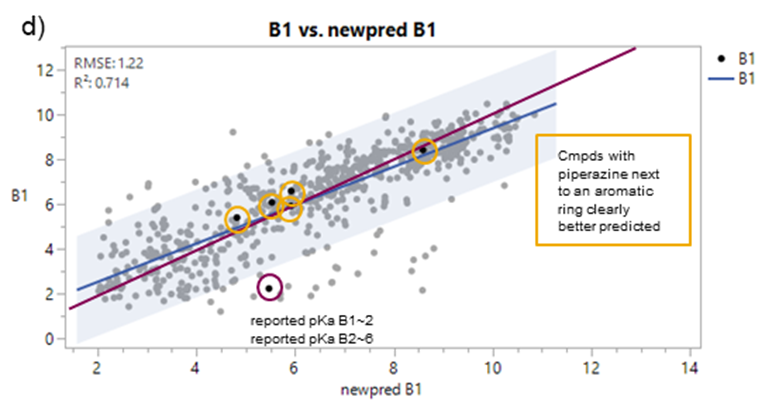
To assess the effectiveness of these improvements, predictions from the old and new pKa prediction algorithms were compared using Data Set 2, which included both acidic and basic pKa values. The graphs below show a comparison of the most acidic (A1) and most basic (B1) values specifically. The blue regression line and purple unity line illustrate the relationship between predicted and observed values, demonstrating the improved predictive performance achieved through these refinements.
Additionally, Figure 4b highlights the significant improvement in prediction accuracy for compounds containing a piperazine next to an aromatic ring after training.


Conclusions
The integration of AstraZeneca’s high-quality experimental data into the ACD/Labs pKa prediction algorithm led to the identification of two new dissociating centers. The updated prediction model demonstrated greater accuracy in training data, and further evaluation with Data Set 2 indicated improved predictions, particularly for basic compounds containing piperazines adjacent to an aromatic ring.
A quick inspection revealed that there were at least two significant outliers in Figure 4: One involved an acidic compound where the most acidic pKa was outside the experimental range, causing pKa A1 to be assigned an artificially high value (Figure 4a). The second case involved a basic compound, where the experimental pKa values for B1 and B2 were inadvertently swapped (Figure 4b) and hence the experimental value for B1 in the plot was greatly underestimated. Similar discrepancies may affect the statistical significance of the observed improvements. However, a more detailed analysis of the experimental data was beyond the scope of this investigation.
Analysis of the results of Data Set 2 shows that for a complex property like pKa it is necessary to continuously expand the training dataset. This is due to the ongoing emergence of new classes of compounds that are not adequately represented by the current predictive algorithm. However, for classes of compounds similar to those already present in the training dataset, significant improvements in prediction accuracy are observed.
Download to read offline.