June 26, 2025
by Mikhail Elyashberg, Leading Researcher, ACD/Labs
Computer-Assisted Elucidation of Myrtinol E Using Structure Elucidator Suite
Backhousia myrtifolia, a member of the Myrtaceae family, is a small tree native to the subtropical rainforests of eastern Australia. Originally discovered and utilized by Indigenous Australian communities, its leaves were traditionally used to soothe colicky infants. The species is also known for its aromatic oils, which have a cinnamon-like scent and exhibit both antibacterial and antifungal properties.
Radju and coworkers [1], during a search to discover new aninlammatory molecules, explored the leaves of B. myrtifolia, which resulted in the isolation and identification of six new peltogynoid type flavonoids along with three known compounds.
One of the new compounds was Myrtinol E (1).
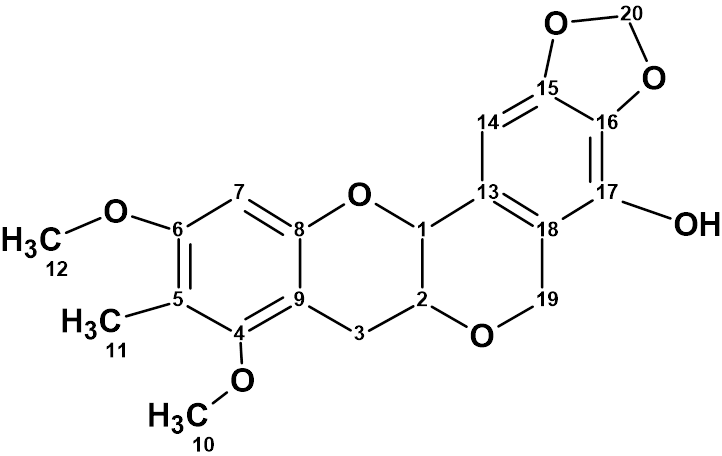
1
Myrtinol E (1) was obtained as a yellow solid. The molecular formula was found to be C20H20O7 from HR-ESI (-) MS ion analysis. We repeated the structure elucidation of this compound using ACD/Structure Elucidator. In the work [1], 1D and 2D NMR data were used (HSQC, HMBC, COSY and NOESY) which are shown in Table 1.
Table 1. NMR spectroscopic data of Myrtinol E.
| Label | δC | δCcalc, (HOSE) |
XHn | δH | H to C HMBC | COSY | NOESY |
| C 1 | 74.6 | 71.92 | CH | 4.58 | C 2, C 13, C 18 | 3.67 | |
| C 2 | 72.7 | 70.32 | CH | 3.67 | 3.14, 4.58 | ||
| C 3 | 28 | 26.82 | CH2 | 3.14 | C 2, C 1, C 9, C 8, C 4 | 3.67 | |
| C 3 | 28 | 26.82 | CH2 | 2.65 | |||
| C 4 | 158.3 | 156.78 | C | ||||
| C 5 | 112.8 | 109.77 | C | ||||
| C 6 | 158.8 | 157.75 | C | ||||
| C 7 | 101.9 | 96.89 | CH | 6.36 | C 9, C 5, C 8, C 6 | 3.8 | |
| C 8 | 154.8 | 154.26 | C | ||||
| C 9 | 108 | 106.32 | C | ||||
| C 10 | 60.1 | 61.16 | CH3 | 3.73 | 2.06 | ||
| C 11 | 8.7 | 7.8 | CH3 | 2.06 | C 5, C 4, C 6 | 3.73 | |
| C 12 | 55.7 | 56.3 | CH3 | 3.8 | C 6 | 6.36 | |
| C 13 | 118.4 | 128.85 | C | ||||
| C 14 | 98.6 | 97.54 | CH | 6.72 | C 1, C 13, C 18, C 15, C 16 | ||
| C 15 | 134.9 | 148.15 | C | ||||
| C 16 | 148.8 | 136.55 | C | ||||
| C 17 | 137.5 | 137.89 | C | ||||
| C 18 | 128.4 | 115.7 | C | ||||
| C 19 | 65.8 | 64.91 | CH2 | 4.91 | C 2, C 13, C 18, C 17 | ||
| C 19 | 65.8 | 64.91 | CH2 | 4.76 | |||
| C 20 | 101.9 | 101.87 | CH2 | 5.93 | C 15, C 16 |
Before starting the procedure of computer analysis of this compound, it was interesting to check whether structure 1 was correct. For this, 13C chemical shift prediction was carried out for structure 1 using the three methods provided in our program. The results of the calculations are shown in Figure 1.
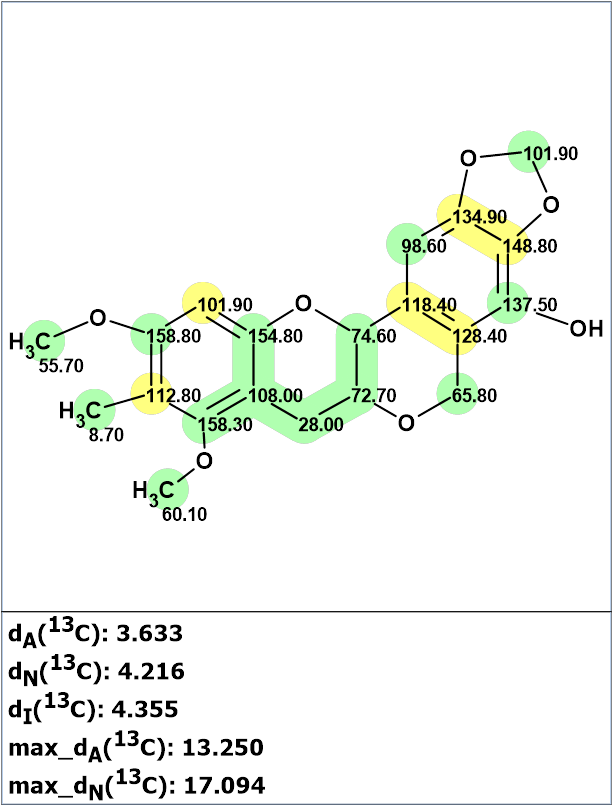
Figure 1. Structure of Myrtinol E (1) proposed by Raju et al [1] for which 13C chemical shift prediction was carried out using the HOSE code-based method, the neural networks, and the incremental approach. Average deviations of 13C chemical shifts determined by these methods are denoted as dA, dN and dI correspondingly. Each atom is colored to mark a difference between its experimental and calculated 13C chemical shifts. Green represents a difference between 0 and 3 ppm and yellow between 3 and 15 ppm.
We see that the average values of deviations of the calculated spectra from the experimental ones do not necessarily confirm the validity of the structure. To clarify the diagnosis, we analyzed the correspondence of 13C experimental chemical shifts to the calculated values (columns dC and dCcalc, (HOSE) in Table 1). The comparison shows that there are two pairs of chemical shifts in this structure, (134.9 and 148.8) and (118.4 and 128.4), which, apparently, should be transposed, assuming the HMBC correlations allow for this. This assumption will be automatically verified as a result of the structure elucidation process using Structure Elucidator.
The molecular formula of Myrtinol and the spectroscopic data presented in Table 1 were entered into the program that created the MCD – molecular connectivity diagram (Figure 2).
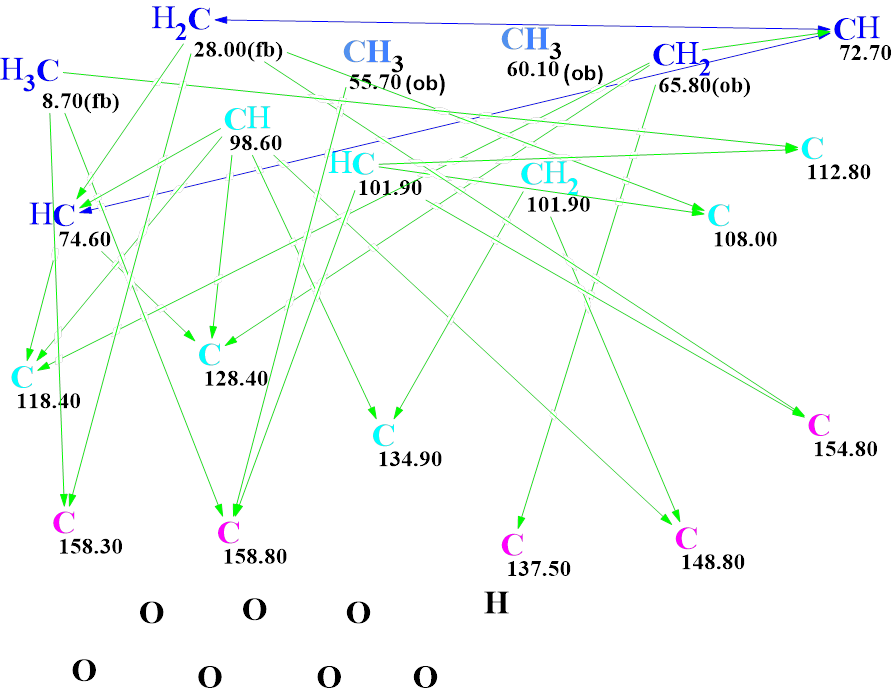
Figure 2. Molecular connectivity diagram (MCD) of Myrtinol E. The hybridizations of carbon atoms are marked by the corresponding colors: sp2 – violet, sp3 – blue, not sp – light blue. Labels “ob” and “fb” are set by the program to carbon atoms for which neighboring with an heteroatom is either obligatory (ob) or forbidden (fb). HMBC connectivities are marked by green arrows, while COSY connectivities – by blue arrows.
Checking the MCD for the presence of contradictions showed that all 2D NMR data were consistent. Therefore, strict structure generation accompanied by 13C chemical shifts prediction was initiated. Results: k = 2188 → (Structural Filtering) → 32 → (Duplicate Removal) → 8, tg = 12 s. The structures of the output file ranked in ascending order of the deviation values of the calculated spectra from the experimental ones are shown in Figure 3.
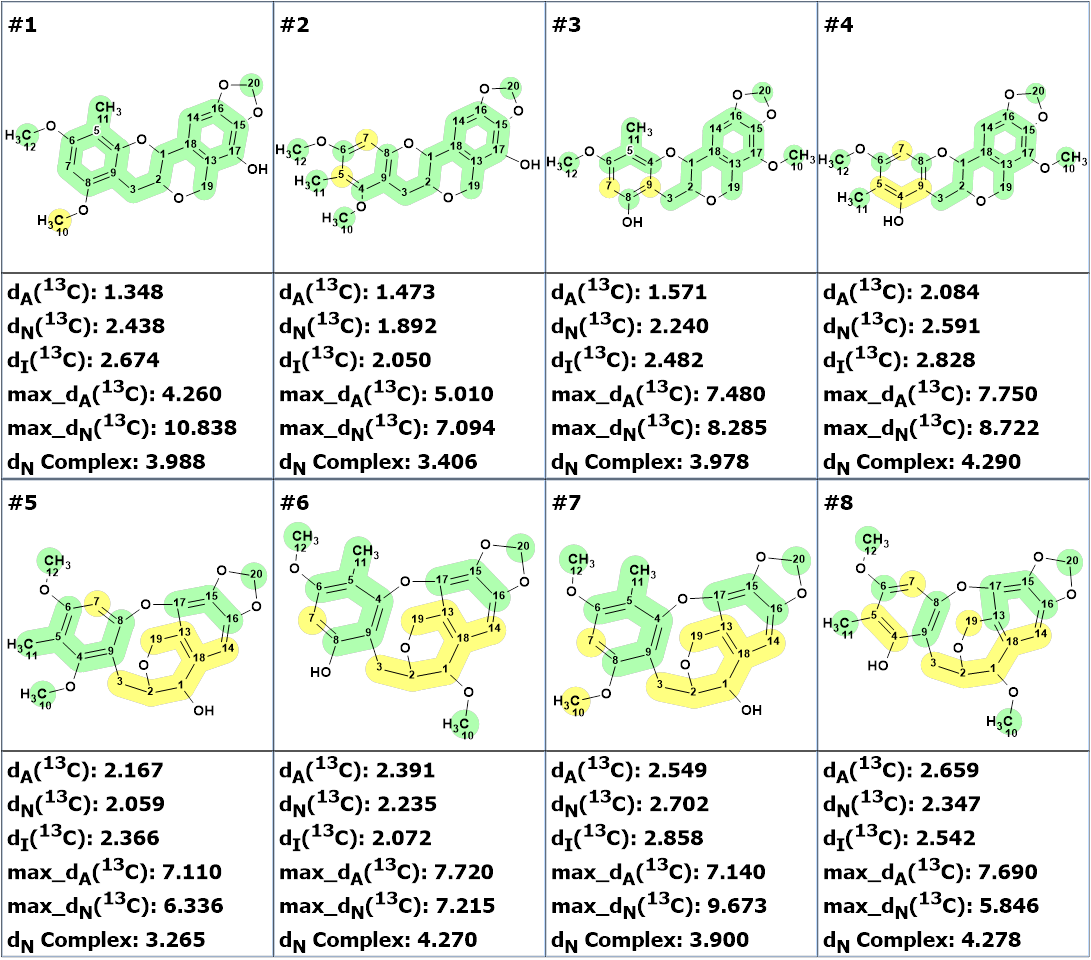
Figure 3. The ranked output file. 13C chemical shift prediction was carried out using the HOSE code-based method, the neural networks, and the incremental approach. The average deviations of 13C chemical shifts determined by these methods are denoted as dA, dN and dI correspondingly. Each atom is colored to mark a difference between its experimental and calculated 13C chemical shifts. Green represents a difference between 0 and 3 ppm and yellow between 3 and 15 ppm.
We see that the structure proposed by the authors [1] is in the second position, while structures #5 – #8 can be excluded from consideration. Obviously, in order to identify the preferred structure, it is necessary to collect additional information. In this case, NOESY data which were not used in structure elucidation so far can now be used (Table 1). The corresponding correlations are shown in Figure 4.

Figure 4. The top four structures of the output file. The NOESY correlations are marked by brown arrows.
From this figure it can be seen that only structure #2 can satisfy the NOESY correlations observed. This structure coincides with the one proposed by authors [1], but the values of the two pairs of 13C chemical shifts mentioned above are transposed. Such a change is allowed by the observed HMBC correlations (Figure 5).
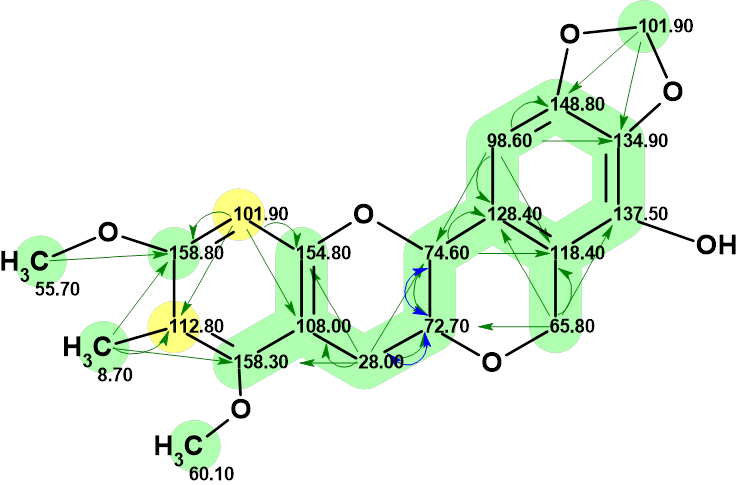
Figure 5. Structure #2 with assigned 13C chemical shifts. HMBC and COSY correlations are marked by green and blue correspondingly.
Furthermore, the DP4 probabilities were calculated for structures #1 and #2. The results are shown in Figure 6 which confirm the correctness of structure #2.
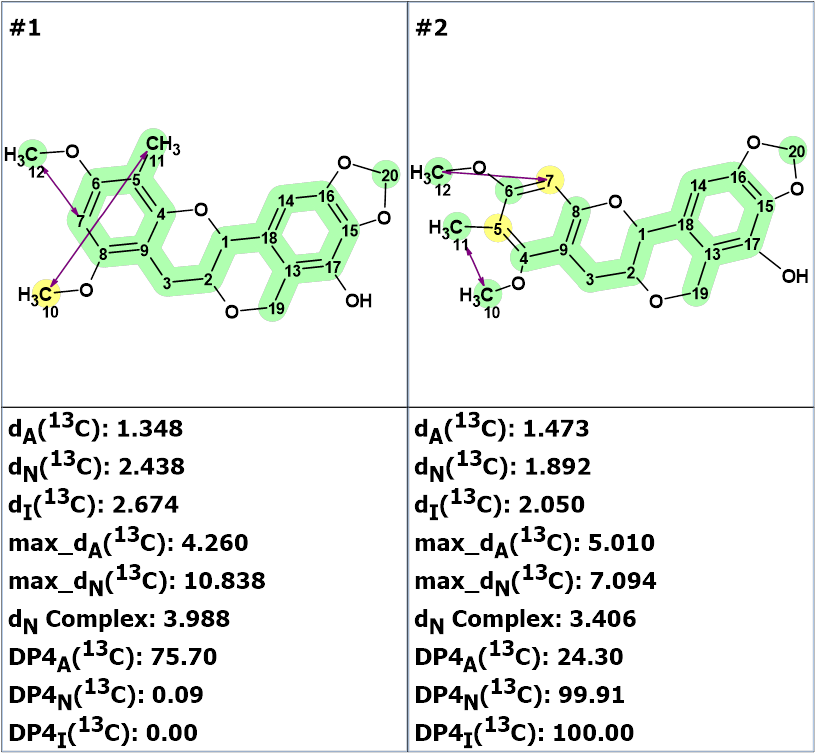
Figure 6. DP4 probabilities calculated for structures #1 and #2.
Thus, our calculations confirmed structure 1 proposed by the authors [1], but at the same time we found two pairs of chemical shifts that were incorrectly assigned. This is a consequence of the fact that the new structures described in [1] have not been verified by predicting chemical shifts using empirical or DFT methods. Obviously, in the structure of Myrtinol A, which is similar to structure 1, it is also necessary to rearrange the two pairs of 13C chemical shifts.
References
- S. Mathew, K. Zhang, X. Zhou, R. Raju. (2023). Myrtinols A–F: New Anti-Inflammatory Peltogynoid Flavonoid Derivatives from the Leaves of Australian Indigenous Plant Backhousia myrtifolia. Molecules, 28, 2160. https://doi.org/10.3390/molecules28052160
About the Author