September 1, 2016
by Mikhail Elyashberg, Leading Researcher, ACD/Labs
Pepluacetal
Many species of the genus Euphorbia are well-known medicinal plants. Their characteristic chemical constituents, “Euphorbia diterpenoids”, have been the focus of natural product drug discovery due to their structural diversity and broad spectrum of biological activities. One of the diterpenoids, ingenol mebutate (PEP005, Picato, LEO Pharma) from E. peplus, has recently been approved in the United States and the European Union for the treatment of actinic keratosis.
Wan et al [1] have isolated and identified three highly modified and biogenetically related diterpenoids including Pepluacetal (1). Spectroscopic analyses, single crystal X-ray diffraction, as well as electronic circular dichroism measurements and calculations were used to determine the structures and absolute configurations of the diterpenoids. The three diterpenoids have novel unprecedented fused-ring skeletons. In particular Pepluacetal contains cyclopentane and cyclobutane rings which rarely occur in natural compounds.
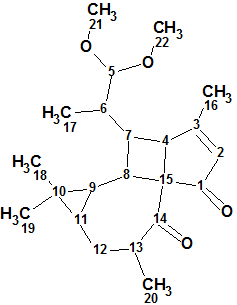
1
Pepluacetal (1) forms colorless crystals and has a molecular formula of C22H32O4 with seven double-bond equivalents as established by the HR-MS ion peak at m/z 383.2193 [M +Na]+ (calcd 383.2198). The 13C NMR spectrum exhibits 22 carbon signals. 1D and 2D NMR spectra (HSQC, COSY and HMBC) were used for structure elucidation in [1].
In order to challenge ACD/Structure Elucidator all NMR spectroscopic data were entered into the program except the COSY spectrum (Table 1). Only key HMBC correlations were available from the article [1].
Table 1. Pepluacetal. NMR spectroscopic data entered into Structure Elucidator.
| Label | δC | δC calc* | XHn | δH | Mult., J | C HMBC |
| C 1 | 203.700 | 204.880 | C | |||
| C 2 | 133.200 | 127.560 | CH | 5.990 | s | C 4, C 15 |
| C 3 | 176.500 | 181.450 | C | |||
| C 4 | 45.900 | 51.030 | CH | 3.960 | d(10.1) | C 1, C 8, C 14 |
| C 5 | 107.100 | 108.190 | CH | 3.930 | u | C 7, C 21, C 22 |
| C 6 | 38.600 | 39.120 | CH | 1.650 | u | |
| C 7 | 46.500 | 43.200 | CH | 2.450 | u | C 3, C 9 |
| C 8 | 41.900 | 42.580 | CH | 2.170 |
u | C 2, C 4 |
| C 9 | 28.500 | 25.400 | CH | 0.570 | dd(8.7, 5,5) | |
| C 10 | 18.200 | 15.980 | C | |||
| C 11 | 22.800 | 24.210 | CH | 0.790 | u | |
| C 12 | 26.900 | 28.790 | CH2 | 2.220 | u | C 9, C 14, C 20 |
| C 12 | 26.900 | 28.790 | CH2 | 1.810 | u | |
| C 13 | 45.800 | 45.110 | CH | 3.060 | u | |
| C 14 | 205.300 | 211.150 | C | |||
| C 15 | 66.600 | 71.860 | C | |||
| C 16 | 20.100 | 19.390 | CH3 | 2.170 |
s | |
| C 17 | 12.800 | 13.200 | CH3 | 1.000 | d(6.5) | C 5, C 7 |
| C 18 | 28.600 | 30.520 | CH3 | 1.030 | s | C 9, C 19 |
| C 19 | 15.500 | 18.290 | CH3 | 0.990 | s | C 11 |
| C 20 | 14.000 | 18.980 | CH3 | 1.150 | d(6.9) | C 14 |
| C 21 | 56.100 | 53.220 | CH3 | 3.340 | s | |
| C 22 | 55.200 | 53.220 | CH3 | 3.320 | s |
* 13C chemical shift prediction was performed using HOSE code based approach [2].
Figure 1 shows a Molecular Connectivity Diagram created from the data presented in Table 1.
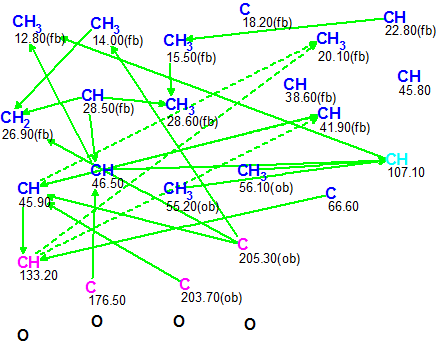
Figure 1. Pepluacetal. Molecular Connectivity Diagram (MCD)
Molecular Connectivity Diagram Overview
The figure shows that one carbon atom is colored in light blue color, which means that its hybridization was not determined exactly by the program (sp3 or sp2, but not sp). For some carbon atoms the possibility of neighboring heteroatoms was automatically set from 13C and 1H chemical shift analysis (ob – obligatory, fb – forbidden). Carbon atoms which are sp3-hybridized are colored dark blue, but those which are sp2-hybridized are pink. Ambiguous connectivities that account for overlapping 1H resonances at d 2.17 are marked by dotted lines. Information about signal multiplicities in the 1H spectrum was introduced in accordance with the corresponding data presented in Table 1 (column Mult., J). There were no edits required on the MCD.
Checking MCD for the presence of contradictions showed that all 2D NMR data were consistent and Strict Structure Generation was initiated. Generation was followed by 13C chemical shift prediction and structure filtering; rejecting structures with average deviations more than 5 ppm. Results: k=744à52à16, tg =21 s.
Figure 2 shows the six top structures generated and ranked in increasing order of average 13C chemical shift deviations calculated by the HOSE code based method (dA). The deviations calculated using the neural network (dN) and incremental (dI) approaches [2], as well as values of maximum deviations max_dA(13C), are also given.
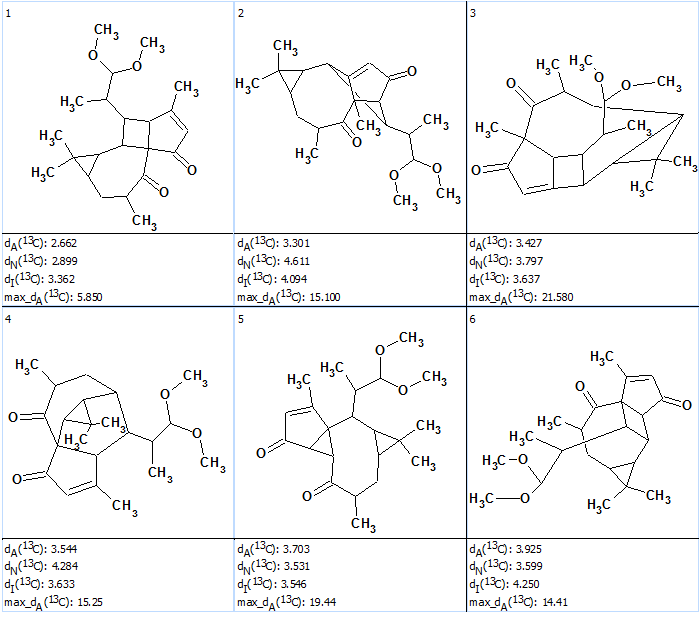
Figure 2. Pepluacetal. Six top ranked structures of the output file.
Figure 2 shows that all three methods of 13C chemical shift prediction confidently distinguish structure #1 which coincides with structure of Pepluacetal determined by authors [1] and confirmed by X-ray crystallography and electronic circular dichroism measurements and calculations.
The structure of Pepluacetal together with 13C chemical shift assignment performed by the program is shown below:
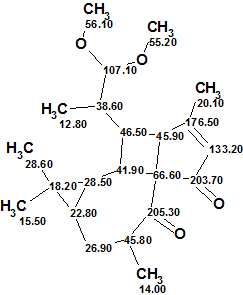
The results show that the structure of a natural product which possesses an unprecedented skeleton was elucidated by ACD/Structure Elucidator rapidly and fully automatically using only key HMBC correlations.
References
- L.-S Wan, Y. Nian, C.-J. Ye, L.-D. Shao, X.-R. Peng, C.-A. Geng, Z.-L. Zuo, X.-N. Li, J. Yang, M. Zhou, M.-H. Qiu. (2016). Three Minor Diterpenoids with Three Carbon Skeletons from Euphorbia peplus.. Org. Lett., 18(9): 2166–2169, DOI: 10.1021/acs.orglett.6b00787
- M.E. Elyashberg, A.J. Williams. (2015). Computer-based Structure Elucidation from Spectral Data (p. 454). Springer-Verlag Berlin, Heidelberg.
About the Author