September 1, 2019
by Dimitris Argyropoulos, NMR Business Manager, ACD/Labs
Synthetic product, C14H13N3O
This month’s elucidation is a bit different. We will see the case of an unexpected synthetic product coming from Leibniz-Forschungsinstitut für Molekulare Pharmakologie (FMP) in Berlin, from the lab of Dr. Marc Nazaré. The dataset was provided to ACD/Labs as part of our Structure Elucidation Suite Challenge1 by Dr. Peter Schmieder. Dr. Rana Alsalim, Dr. Peter Lindemann and Dr. Edgar Specker also worked on this project.
The product was isolated after a reaction and it was found by HR-MS to have a molecular formula of C14H13N3O. Even though it is a rather small molecule it presented some quite interesting challenges.
To begin with, the spectra indicated that the sample was not particularly clean. In the 1D 1H spectrum shown in Figure 1 we can see that apart from the well-defined peaks in the aromatic region there is a broad group of peaks at around 3.8 ppm and several smaller peaks below 2.5 ppm. Quite a few of the peaks are known common impurities, like the peaks at 0.8 ppm and 1.29 ppm that probably appear because of the lubricating grease that was used on the ground glass joints of the glassware, but several others are really unknown. Interestingly the areas where peaks are, appear to be sitting on top of broad features of the spectrum, indicating a variety of similarly structured compounds. The fact that the TMS line appears nice and sharp eliminates the possibility of an instrumental problem (e.g. mis-set high order shims). Fortunately the situation is much clearer in the 13C spectrum (Figure 2) where only a little bit of “chemical noise” is observed and in all cases the intensities are much lower than the intensities of the real sample peaks.
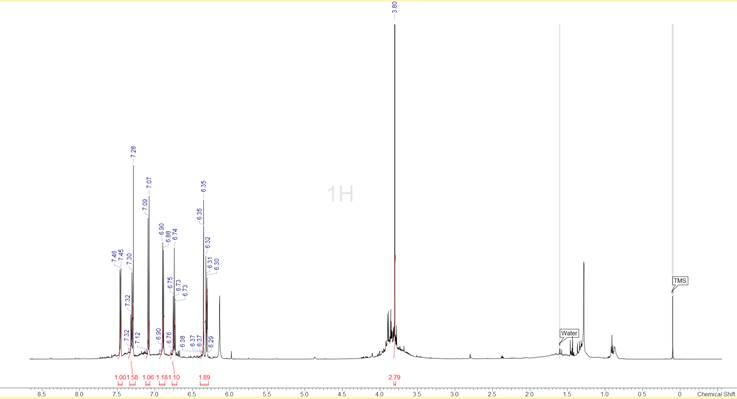
Figure 1: The 1D 1H spectrum of the compound. The peak-picking and integration have been done after the HMQC spectrum was analysed.
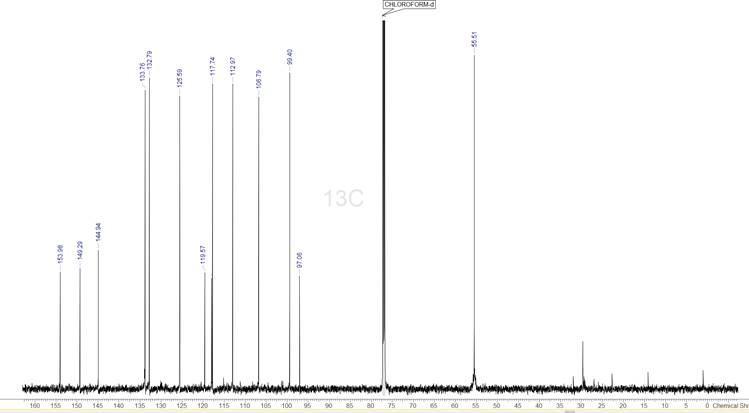
Figure 2: The 1D 13C spectrum of the compound. The 14 strongest peaks have been picked.
The 1D 13C spectrum has 14 signals, which corresponds exactly to the number of carbons in the supplied MF. We will be using this to help us identify which are the proper peaks to select in all the other spectra.
Before proceeding to the actual elucidation it is a good idea to see if there is any known compound that has a similar carbon spectrum. This step is generally referred to as “dereplication”—if something known exists with a similar spectrum then one can avoid spending time doing the whole elucidation again, replicating what is already known. ACD/Structure Elucidator comes with a database of ca. 98 million predicted 13C spectra for all the structures of the compounds found in PubChem. This database is fully searchable by the peaks observed in the 13C spectra (1D and 2D HSQC, HMBC). The molecular weight and molecular formula can also be used, if known, to facilitate the search.
A search of this database for something similar to the product we had gave, in essence, no results. If one does a strict search (i.e. all the peaks visible are true peaks and not impurities, and none is missing or extra) then there is nothing found. If the criteria about the excess or lack of peaks are relaxed then some structures start appearing but it is evident that they are not correct. Some results from this search are shown in Figure 3. The only fact that is verified is that there are at least two aromatic rings in this structure. This is a bit surprising because one would have thought that such a small molecule would have been known. Apparently this is not the case, so we proceed with the complete elucidation.
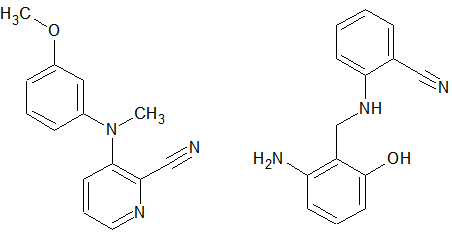
Figure 3: A couple of the structures that were found by the program to have similar 13C spectra, with up to 2 missing or extra peaks. Even though it is clear that they are not correct (the left one has 2 methyl groups, the right one has a methylene and no methyl group) the result indicates that we probably have two aromatic rings and a nitrile group.
The next step is to analyse the 1H-{13C} HMQC spectrum (Figure 4). Since we know where the 13C signals are we can focus on these frequencies only, thus avoid accidentally selecting erroneous peaks. We can identify 8 peaks in the HMQC spectrum which when correlated to the 1D 1H spectrum show us that we have 7 aromatic protons, all of them CH’s, and one singlet peak at 3.8 ppm which appears to be a methyl, after looking at the integration.
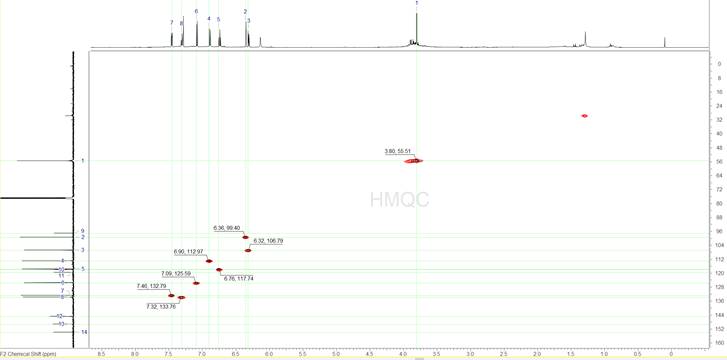
Figure 4: The 1H-{13C} HMQC spectrum
The 1H-{13C} HMBC spectrum (Figure 5) is analysed in the same way, only picking the peaks that have been identified so far as being legitimate sample peaks, both on the 1D 13C and the 1D 1H spectra. In the case of this spectrum there are several more erroneous peaks that appear. Some of them are because of the single bond artefacts that are very common in HMBCs and some other because of the impurities. ACD/Labs software has algorithms built-in and will automatically avoid picking single bond peaks in HMBC spectra. The general strategy here is to only pick the peaks that one is certain about and avoid over-picking and thus constraining the problem without a reason.
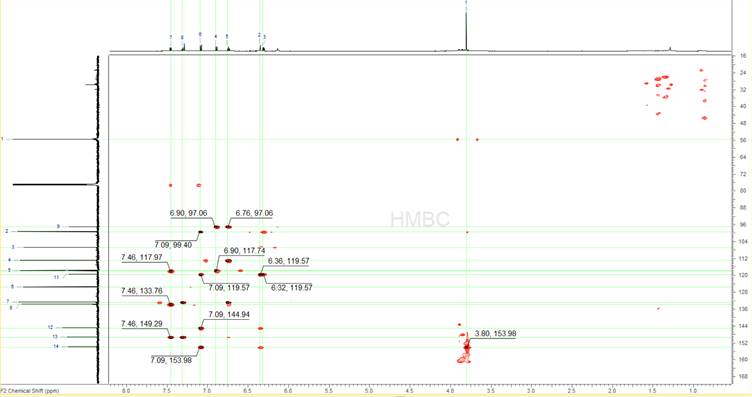
Figure 5: The 1H-{13C} HMBC spectrum
A 2D-COSY spectrum was also supplied (not shown) that helps identify the coupling networks of the aromatic protons and safely establish that we have two aromatic rings in the structure. The full list of spectral data obtained by these spectra is shown in Table 1, automatically generated by ACD/Structure Elucidator.
Table 1. Table of Spectral Data for the spectra analysed.
| C Shift |
XHn | H Shift |
H Multiplicity |
COSY | C to H HMBC |
H to C HMBC |
| 55.511 | CH3 | 3.802 | s | 153.98 | ||
| 99.401 | CH | 6.357 | m | 7.09 | 119.57 | |
| 106.795 | CH | 6.32 | dd (7.93, 2.44) |
7.09 | 119.57 | |
| 112.971 | CH | 6.902 | d (8.54) |
7.32 | 6.76 | 97.06, 117.74 |
| 117.739 | CH | 6.758 | m | 7.32, 7.46 |
6.9 | 97.06, 112.97, 132.79 |
| 125.588 | CH | 7.09 | d (7.93) |
6.32 | 99.40, 119.57, 144.94, 153.98 |
|
| 132.787 | CH | 7.456 | m | 6.76 | 6.76, 7.32 |
117.97, 133.76, 149.29 |
| 133.759 | CH | 7.315 | m | 6.76, 6.90 |
7.46 | 132.79, 149.29 |
| 97.06 | C | 6.76, 6.90 |
||||
| 117.97 | C | 7.46 | ||||
| 119.571 | C | 6.32, 6.36, 7.09 |
||||
| 144.938 | C | 7.09 | ||||
| 149.29 | C | 7.32, 7.46 |
||||
| 153.975 | C | 3.80, 7.09 |
Together with Table 1, ACD/SE generated the Molecular Connectivity Diagram shown in Figure 6.
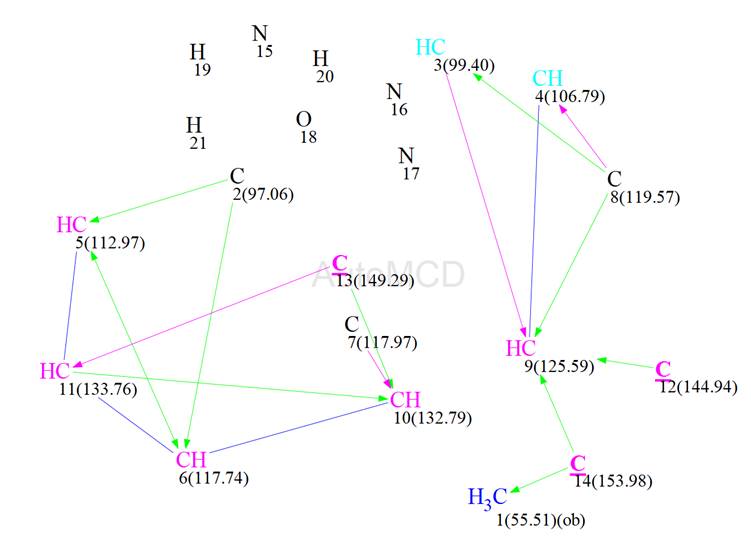
Figure 6: The automatically generated MCD. Manual edits, as described in the text, are underlined.
Carbon atom hybridization was defined by the program automatically. There were only 3 edits made, these being for carbon 12 (144.94 ppm), carbon 13 (149.29 ppm) and carbon 14 (153.98 ppm) who were set to be of sp2 hybridization. There were two carbons coloured light blue (C3 at 99.4 ppm and C4 at 106.79 ppm), meaning that these could not be of sp hybridization and 3 carbon atoms coloured black (C2 at 97.06 ppm, C7 at 117.97 ppm and C8 at 119.57 ppm) meaning that they were of unknown hybridization. Also carbon C1, at 55.51 ppm, was labelled with “ob” meaning that it must be connected to a heteroatom. The HMBC correlations were set as either green (2 -3 bonds) or magenta (4 bonds), depending on their intensity on the spectrum. This was also done automatically by the program. If this appears to be causing problems then Fuzzy Structure Generation can be activated.
The MCD was checked for contradictions and it passed with only a warning, that there were more 1H atoms in the MF than detected in the spectra. This is usually an indication that there are some exchangeable protons (e.g. -OH or –NH groups) that are not visible, and it is not a problem for ACD/SE. After the test, common mode generation was initiated by also selecting the option to allow bonds between heteroatoms and to allow bonds between heteroatoms of the same kind, since one of the precursor molecules had a diazonium group. The results were: k = 660474 → (filtering) → 10 → (removing duplicates) → 7, tg = 13m 15s.
The results were ranked by the average deviation between experimental and predicted 13C chemical shifts. In the previous Elucidations of the Month we have been ranking the results using 13C chemical shifts predicted with the HOSE codes approach. This time we used both the HOSE codes method and artificial neural networks. The top 3 structures, ranked in increasing average deviation using the neural networks approach, are shown in Figure 7.
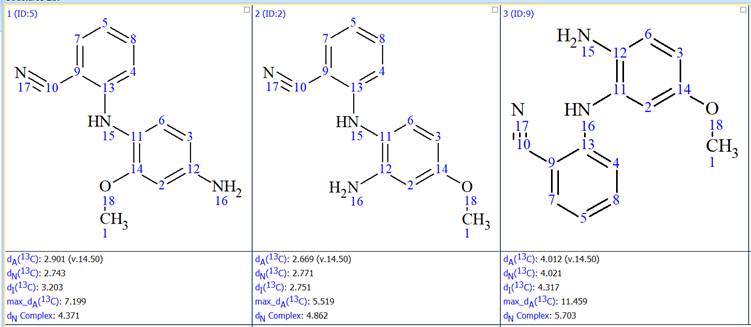
Figure 7: The top 3 structures generated
We see that the difference in the average deviation between the first and the second structure is very small. Using the neural networks approach the first structure has an average deviation, dN(13C), of 2.743 ppm and the second 2.771 ppm. Using the HOSE codes approach the first structure has an average deviation, dA(13C), of 2.901 ppm and the second 2.669 ppm. So the first structure is better using the neural networks approach and the second using the HOSE codes. In general average deviations below 3.5 ppm are acceptable, so both the structures are plausible. However the difference in the average deviations is very small and it is not possible to make a safe decision on which one is the correct one. The fact that the two prediction methods give the opposite result is further proof that there is a clear ambiguity in the sorting of the generated structures. One could use here some information from the synthesis of this compound and declare the first structure as the correct one, however since this was a completely unexpected result such an assumption would be dangerous.
It has been shown2-3 that in such cases DFT based chemical shift prediction allows for resolving this ambiguity and selecting the correct structure. However, DFT calculations may not always be an option for some groups, while recording additional NMR spectra is far easier. Since the MF contains nitrogen atoms a 1H-{15N} HMBC was the experiment chosen to be run in addition. This spectrum is shown in Figure 8.
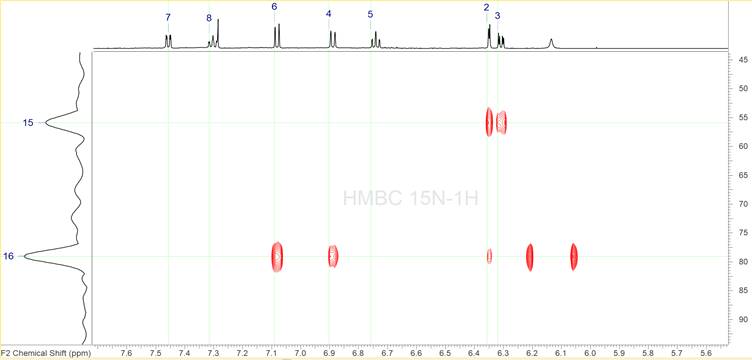
Figure 8: The 1H-{15N} HMBC spectrum.
It is clear that only two of the three nitrogen atoms have been identified in this spectrum. This is not a problem as ACD/SE can solve problems under the conditions when some skeletal atoms have no 2D NMR correlations (“floating atoms”). In fact the MCD shown in Figure 4 already has 3 “floating” nitrogen atoms. We also see that most of the correlations appear to already identified proton signals, confirming their validity. There are two peaks for the nitrogen signal at 79 ppm not correlating to any proton signal, however they appear to be symmetric to a broad proton signal at ca. 6.14 ppm. These peaks are the single bond artefact and the fact that they appear around the broad peak at 6.14 ppm indicate that we have an –NH group.
The rest of the peaks appear to be of similar intensity except of the peak at 6.36 ppm in proton and 79.08 ppm in 15N, which is significantly weaker. While all the other peaks were set as corresponding to a 2-3 bond distance this particular one was set by the program as a 4 bond distance. The new MCD is shown in Figure 9. We see now that there are lines correlating two of the nitrogen atoms to carbons.
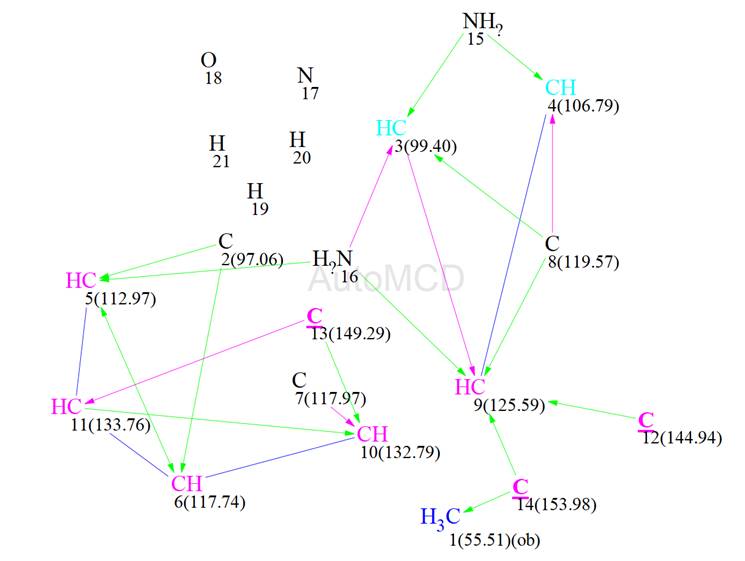
Figure 9: The automatically generated MCD using the 15N correlation data
Common mode structure generation was initiated again and the results were: k = 1800 → (filtering) → 2 → (removing duplicates) → 2, tg = 17s. The two structures generated are shown in Figure 10.
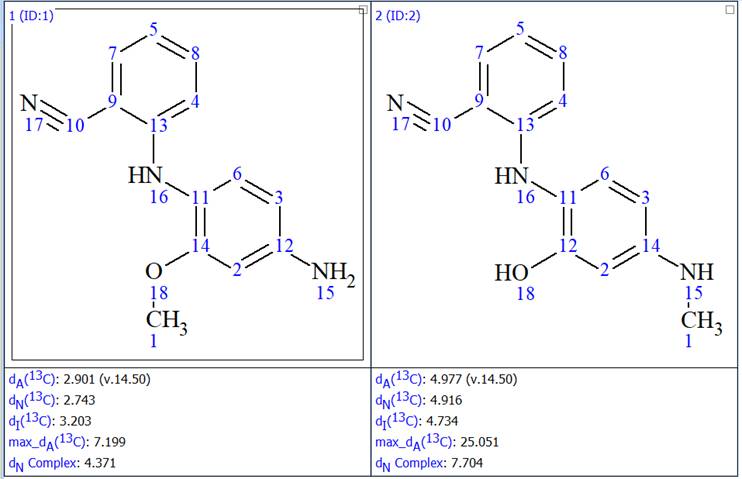
Figure 10: The two structures generated after the MCD was enriched with 1H-15N HMBC data
We now see that only the first structure generated before was generated again, thus the ambiguity that existed has been removed. We also see that the second structure generated has much higher average deviations between the experimental and the predicted chemical shifts, leaving no doubt about the validity of structure 1. We also saw a very spectacular 46x improvement in the structure generation speed.
The generated structure was found to be in agreement with what the FMP Berlin group had in mind and had already determined independently. The full structure together will all the chemical shifts assigned is shown in Figure 11.
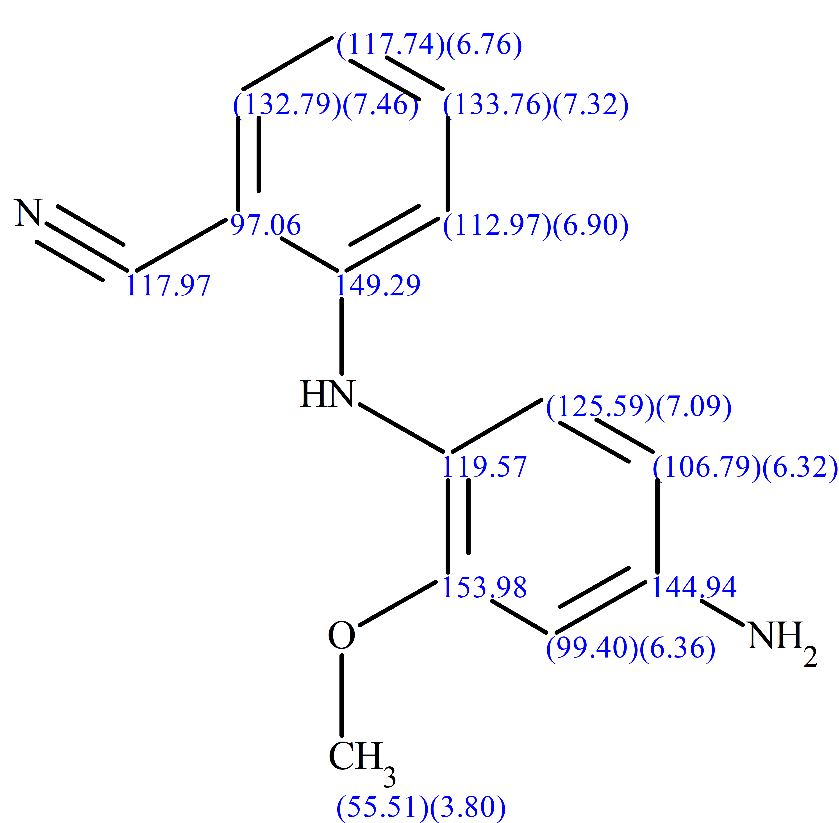
Figure 11: The structure of the synthetic product, together with the 1H, 13C and 15N chemical shifts of the atoms.
The above illustrate the case where additional NMR spectra can not only help in removing ambiguities but also in decreasing the analysis time. Even though DFT calculations are an appealing and maybe easy way out from such situations, sometimes just recording an additional spectrum can have a really determining effect. 1H-15N HMBC spectra are easy to perform with the instruments available these days and should not be considered exotic and only for the experts. The same is true for several other advanced NMR experiments.
References
- ACD/Labs Structure Elucidation Challenge
- A. V. Buevich, M. E. Elyashberg. (2016). Synergistic combination of CASE algorithms and DFT chemical shift predictions: a powerful approach for structure elucidation, verification and revision. J. Nat. Prod., 79 (12):3105–3116.
- A.V. Buevich, M. E. Elyashberg. (2018). Towards unbiased and more versatile NMR-based structure elucidation: A powerful combination of CASE algorithms and DFT calculations. Magn. Reson. Chem., 56: 493–504. DOI: 10.1002/mrc.4645
About the Author
