January 1, 2017
by Mikhail Elyashberg, Leading Researcher, ACD/Labs
4-Bromobenzoic-biscognienyne A
Meroterpenoids are natural products formed by the terpenoid biosynthetic pathway. There has been much interest in them because of their broad structural diversity and range of bioactivity.
Zhao and coworkers [1] isolated the compound Biscognienyne-A, from the lichen Usnea mutabilis sp., as yellowish needle-shaped crystals. In order to help with their ECD experiments, they reacted it with 4-bromobenzoyl chloride to yield 1 (4,5-dihydroxy-5-(3-methylbut-2-en-1-yl)-3-(3-methylbut-3-en-1-yn-1-yl)cyclohex-2-en-1-yl 4-bromobenzoate). The structure was determined from HR-MS and NMR data and confirmed by calculation of the ECD spectrum.
The molecular formula of compound 1 was determined by HR-MS as C23H25O4Br.
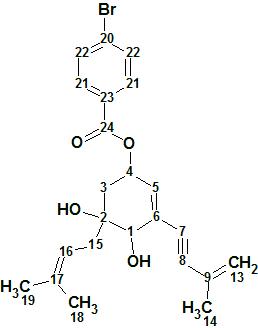
1
Structure 1 is relatively simple but its elucidation was chosen as a demonstrated approach, using ACD/Structure Elucidator, in situations where several equiprobable user assumptions (“axioms”) should be checked to determine the right structure.
The IR spectrum of an unknown should be considered an integral part of the data set used for structure elucidation. It allows easy detection of functional groups like OH, NH, C=O, NO2, CºC, CºN, etc. The appearance of an IR absorption band in the region of 2100-2300 cm-1 is evidence of a triple bond. Zhao and coworkers [1] did not record an IR spectrum for compound 1 but several IR spectra have been reported for similar structures. In these there was an absorption band detected in the region of 2180-2200 cm-1. This is a clear evidence that there is a triple CºC bond, which is key in elucidating the structure.
ACD/Structure Elucidator allows the user to define some of the functional groups that are present in the molecule [2]. There is also an option to search the Fragment Library using the experimental 13C spectrum in order to identify potential fragments. Such a search using the experimental 13C spectrum of compound 1 yielded a total of 794 fragments. Searching for functional groups in these results yielded the groups shown in Figure 1.
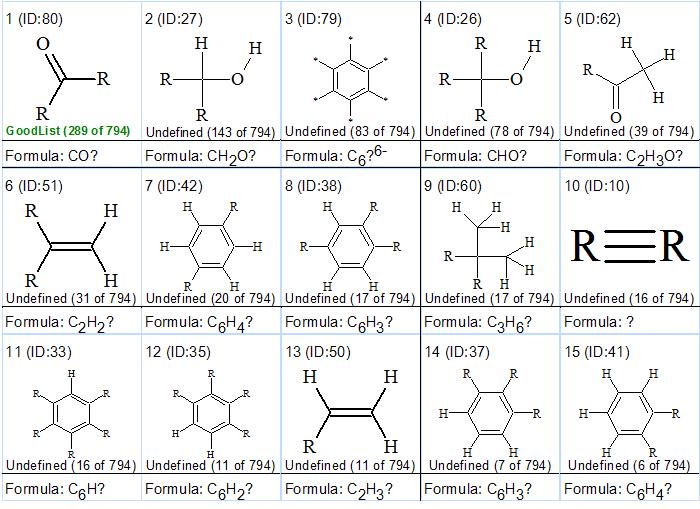
Figure 1. Functional group distribution (“generalized portrait” of a molecule)
Figure 1 shows that groups 1-4, 6-7, 9-10 (including CºC) are present in structure 1. It is necessary to note that this distribution does not prove that the mentioned groups are present but only shows that this is plausible. The presence of a triple bond, as shown by the IR spectrum, is in agreement with the “generalized portrait” of the molecule.
The 1D and 2D NMR spectroscopic data from the Supporting Information to [1] are presented in Table 1.
Table 1. NMR spectroscopic data.
| C Label | δC | δC calc* | CHn | δH | H to C HMBC |
| C 1 | 71.1 | 73.2 | CH | 3.99 | C 5, C 6, C 7, C 12 |
| C 2 | 75.1 | 71.66 | C | ||
| C 3 | 37.5 | 39.71 | CH2 | 2.29 | C 1, C 2, C 5 |
| C 3 | 37.5 | 39.71 | CH2 | 1.78 | C 1 |
| C 4 | 71.4 | 69.02 | CH | 5.75 | C 5, C 6, C 21 |
| C 5 | 134 | 136.3 | CH | 6.08 | C 1, C 3, C 4, C 7 |
| C 6 | 128.5 | 124.74 | C | ||
| C 7 | 88.1 | 88.08 | C | ||
| C 8 | 92.5 | 96.73 | C | ||
| C 9 | 128.3 | 125.02 | C | ||
| C 10 | 122.5 | 123.69 | CH2 | 5.3 | C 8, C 9, C 11 |
| C 10 | 122.5 | 123.69 | CH2 | 5.27 | C 8, C 9, C 11 |
| C 11 | 23.5 | 23.11 | CH3 | 1.91 | C 8, C 9, C 10 |
| C 12 | 38.3 | 37.13 | CH2 | 2.45 | C 1, C 2, C 3, C 13, C 14 |
| C 12 | 38.3 | 37.13 | CH2 | 2.32 | |
| C 13 | 120.1 | 117.78 | CH | 5.24 | C 12, C 15, C 16 |
| C 14 | 135.9 | 135.53 | C | ||
| C 15 | 18.2 | 18.11 | CH3 | 1.64 | C 2, C 13, C 14, C 16 |
| C 16 | 26.2 | 25.86 | CH3 | 1.72 | C 2, C 13, C 14, C 15 |
| C 17 | 130.6 | 128.02 | C | ||
| C 18 | 132.3 | 131.39 | CH | 7.9 | C 20, C 21 |
| C 19 | 133 | 132 | CH | 7.65 | C 17 |
| C 20 | 129.1 | 128.43 | C | ||
| C 21 | 166.6 | 164.29 | C |
* 13C chemical shift calculations were carried out using a HOSE code based approach [2]
To take into account the possibility of a triple bond in the molecule, “Allow sp Carbons” was selected in the “Create MCDs Options” window during the creation of the Molecular connectivity diagram (MCD) (shown in Figure 2):
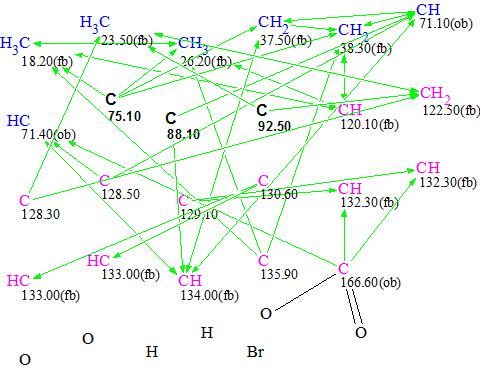
Figure 2. Molecular Connectivity Diagram
MCD overview. Three quaternary carbon atoms – C 75.10, C 88.10 and C 92.50 – are colored in black meaning that their hybridization is not defined and could be anything (sp3, or sp2 or sp). The presence of black atoms on the MCD increases the time it takes to generate a structure as all 27 (33) combinations of hybridizations allowed for these three atoms should be investigated during the structure generation. Since each pair of the three black atoms can form a triple bond, only three combinations need to be checked, which reduces the scope of the problem. To further reduce the generation time, atom C 166.60 was defined as an ester (it was connected with two oxygen atoms manually).
The MCD shown in Figure 2 was duplicated twice and hybridizations of carbons C 75.10, C 88.10 and C 92.50 were defined manually as shown in Figures 3, 4 and 5. Atoms with sp-type hybridization are marked with green color on the MCDs. Multiplicities determined in the 1H NMR spectrum were not used as constraints in order to see how the program would do with these conditions.
Checking the MCD (Figure 2) for the presence of contradictions in HMBC showed that data was inconsistent (the presence of at least one nonstandard HMBC correlation where nJCH, n>3 was detected), and so Fuzzy Structure Generation must be used.
There are two strategies that can be employed for solving the problem:
- Run the CSB Generator command for all MCDs. In this case, structure generation will be performed sequentially for the first, second and third MCDs, and all generated structures will be collected into a single file.
- Run the CSB process for each MCD separately and then compare the solutions obtained.
The first strategy is the standard in fully automatic mode and was used to get a “combined” solution. Fuzzy Structure Generation accompanied with 13C chemical shift prediction and structure filtering was carried out. Structures for which the average 13C predicted chemical shift deviation exceeded 5 ppm were rejected during structure filtering.
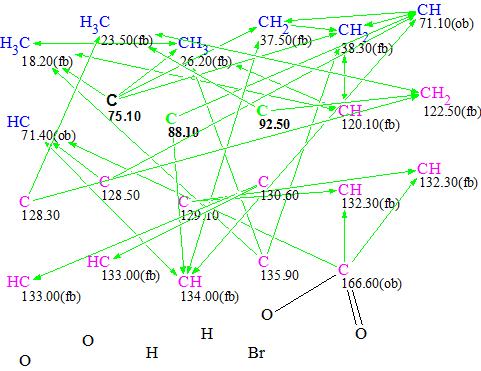
Figure 3. MCD #1.
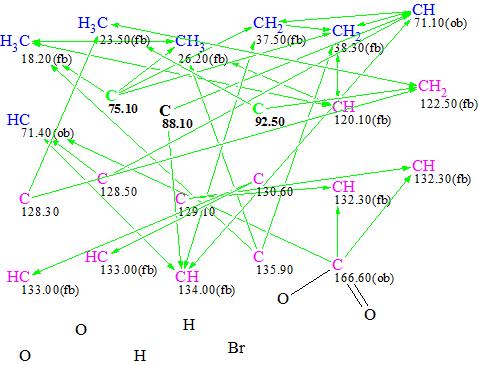
Figure 4. MCD #2
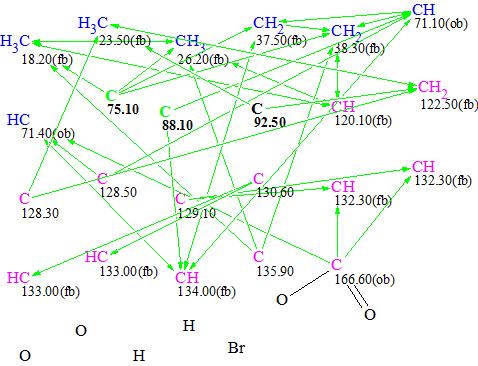
Figure 5. MCD #3
23 structures were stored after the structure generation from the three MCDs (total processing time was around 2 hours). The conventional procedures of 13C chemical shift prediction and structure ranking were performed afterwards [2], and the four top ranked structures are shown in Figure 6.
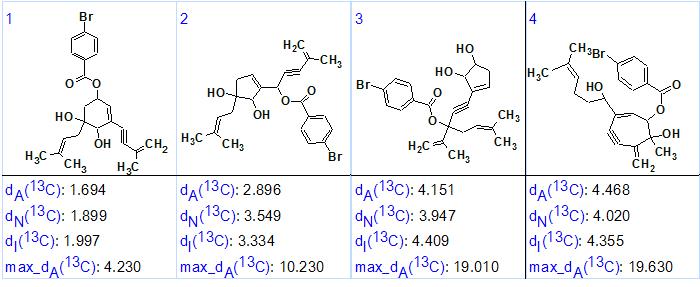
Figure 6. Four top ranked structures.
The first ranked structure coincides with structure 1, and its priority is confirmed by average and maximum deviation values. The 13C chemical shift assignments and the nonstandard HMBC correlations (red arrows) are shown in structure 1a
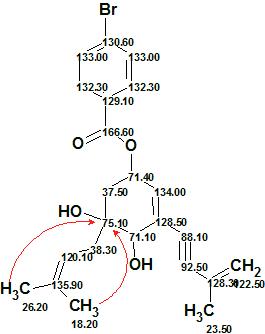
1a
A protocol of structure generation shows that one structure was produced from MCD #1 in 19 s, while the m value (number of nonstandard correlations) was equal to two. One structure was also generated from MCD #2 in 12 min. Attempts of structure generation were made with m=1, 2, 3 and 4 in this case. The corresponding values for MCD #3 were the following: k = 21, tg= 1 h 43 min, m=1, 2, 3, 4, 5, 6.
Figure 7 shows a part of the HMBC spectrum pattern (taken from SI to [1]) where a red arrow points to the peak at H 1.172/C 75.10 while a blue one – to the peak H 1.64/C 75.10 (both correlations marked by red in Table 1). Both peaks correspond to the five bond length correlations shown in structure 1a. It is interesting to note that the intensity of the first peak is almost the same as that observed for standard (2-3JCH) correlations, which is probably because of a W connectivity pattern between interacting nuclei.
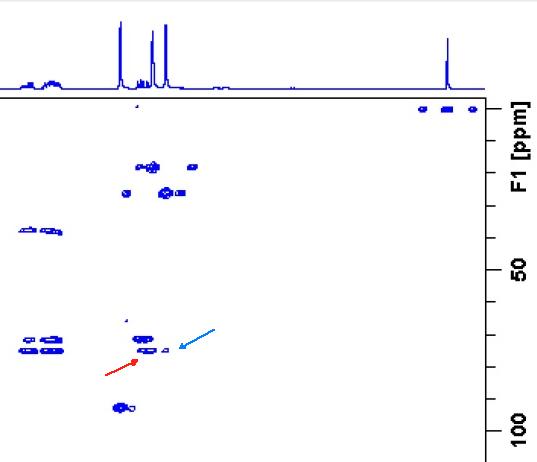
Figure 7. Part of HMBC spectrum pattern. A red arrow points to the intense peak H 1.72 to C 75.1 assigned to the long ranged W-type 5JCH correlation. A blue arrow points to the correlation H1.64 to C 75.1 of the same length.
Therefore ACD/Structure Elucidator allowed us to reliably determine the structure of the unknown compound synthesized in [1] which was also confirmed by ECD spectrum calculation.
References
- H. Zhao, G.-D. Chen, J. Zou, R.-R. He, S.-Y. Qin, D. Hu, G.-Q. Li, L.-D. Guo, X.-S. Yao, H. Gao. (December 9,2016). Dimericbiscognienyne A: A Meroterpenoid Dimer from Biscogniauxiasp. with New Skeleton and Its Activity. Org. Lett. DOI: 10.1021/acs.orglett.6b03264.
- M.E. Elyashberg, A.J. Williams. (2015). Computer-based Structure Elucidation from Spectral Data (p. 454). Springer-Verlag Berlin, Heidelberg.
About the Author