May 17, 2024
by Mikhail Elyashberg, Leading Researcher, ACD/Labs
Hectoramide B
The tropical marine cyanobacterium Moorena producens JHB is known for its abundant secondary metabolites, which hold promise for biomedical applications. While previous investigations uncovered some unique compounds from this strain, genomic analysis indicates the presence of numerous undiscovered biosynthetic gene clusters. In an effort to promote the synthesis of novel compounds, the strain was co-cultured with Candida albicans by Gerwick and coworkers [1]. As a result, the authors observed the increased production of a new compound that was characterized as hectoramide B (1).
1
Hectoramide B (1) was isolated by VLC and HPLC to yield 1.7 mg of a yellow oil from the co-culture experiments. Based on HRMS (exact mass = 627.3750 m/z) a presumed molecular formula for compound 1 was calculated as C34H50N4O7. The 12 degrees of unsaturation required for this molecular formula were deduced by interpretation of NMR data to result from two phenyl rings and four ester/amide-type carbonyls.
The 1H NMR spectrum of compound 1 was remarkably similar to that of the previously determined structure of hectoramide A. Moreover, analysis of the MS/MS fragmentation using GNPS molecular networking, also revealed that both compounds were closely related. Detailed analysis and comparison of NMR and MS/MS data of these compounds being combined with utilizing HSQC, HMBC (56) and COSY (10) correlations allowed the authors [1] to elucidate the structure of heteroamide B.
Table 1. NMR spectroscopic data of compound 1.
| Label | δC | δCcalc HOSE | CHn | δH | M(1H) | COSY | H to C HMBC |
| C 1 | 173.6 | 173.47 | C | ||||
| C 2 | 62.5 | 62.73 | CH | 4.62 | d | 2.15 | C 5, C 3, C 6, C 7, C 1 |
| C 3 | 26.8 | 26.73 | CH | 2.15 | u | 0.69, 0.95, 4.62 | C 5, C 4, C 2 |
| C 4 | 19.1 | 19.67 | CH3 | 0.95 | d | 2.15 | C 5, C 3, C 2 |
| C 5 | 18.3 | 18.47 | CH3 | 0.69 | d | C 4, C 2 | |
| C 6 | 30.8 | 31.13 | CH3 | 2.93 | s | ||
| C 7 | 171.8 | 172.51 | C | ||||
| C 8 | 59.1 | 58.79 | CH | 5.08 | d | 2.27 | C 10, C 9, C 12, C 7 |
| C 9 | 27.9 | 27.99 | CH | 2.27 | u | 0.77, 0.89, 5.08 | C 11, C 10, C 8 |
| C 10 | 18.9 | 19.63 | CH3 | 0.89 | d | 2.27 | C 11, C 9, C 8 |
| C 11 | 18 | 18.43 | CH3 | 0.77 | d | 2.27 | C 10, C 8 |
| C 12 | 30 | 29.58 | CH3 | 2.92 | s | C 8, C 13 | |
| C 13 | 170.5 | 169.73 | C | ||||
| C 14 | 72.8 | 72.59 | CH | 5.37 | u | 3.03 | C 15, C 16, C 21, C 13 |
| C 15 | 36.5 | 38.87 | CH2 | 2.99 | d | C 14, C 16, C 17, C 13 | |
| C 15 | 36.5 | 38.87 | CH2 | 3.03 | d | 5.37 | |
| C 16 | 128.4 | 127.48 | C | ||||
| C 17 | 131 | 130.83 | CH | 7.22 | d | 6.89 | C 15, C 19 |
| C 18 | 114.17 | 112.78 | CH | 6.89 | d | 7.22 | C 16, C 19 |
| C 19 | 159.8 | 157.59 | C | ||||
| C 20 | 55 | 55.15 | CH3 | 3.76 | s | C 19 | |
| C 21 | 170.3 | 170.84 | C | ||||
| C 22 | 70.3 | 70.01 | CH | 3.45 | u | 2.85 | C 23, C 24, C 21 |
| C 23 | 35.2 | 35.56 | CH2 | 2.85 | d | 3.45 | C 22, C 24, C 25, C 21 |
| C 23 | 35.2 | 35.56 | CH2 | 2.89 | d | ||
| C 24 | 129.2 | 130.25 | C | ||||
| C 25 | 130.4 | 130.29 | CH | 6.81 | d | 6.71 | C 23, C 26, C 24, C 27 |
| C 26 | 114.15 | 113.88 | CH | 6.71 | d | 6.81 | C 24, C 25, C 27 |
| C 27 | 159.2 | 158.9 | C | ||||
| C 28 | 55 | 55.04 | CH3 | 3.73 | 0 | C 27 | |
| C 29 | 41.5 | 41.98 | CH3 | 2.39 | u | C 22 |
We see that the structure of compound 1 was determined by comparing its NMR and MS/MS spectra with those of the related compound, as well as using two-dimensional NMR spectra.
Additional information to the two-dimensional NMR data alleviated the structure elucidation of a compound whose molecular formula contains a large number of heteroatoms (4 nitrogen atoms and 7 oxygen atoms). It was interesting to find out how Structure Elucidator Suite would cope with the identification of this structure operating in the standard mode.
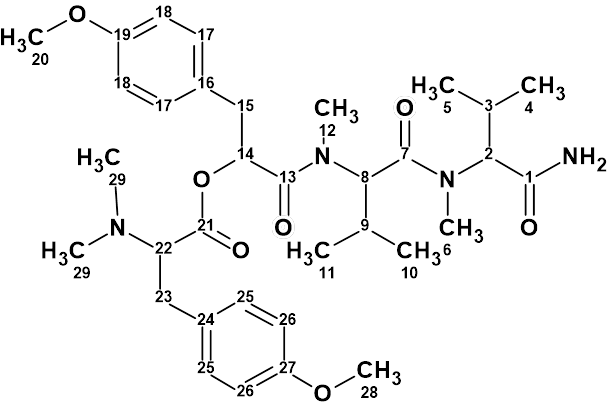
The molecular formula and spectroscopic NMR data (Table 1) used in article [1] were entered into the program. The edited Molecular Connectivity Diagram (MCD) is shown in Figure 1.

Figure 1. Molecular connectivity diagram (MCD) of hectoramide B. The hybridizations of carbon atoms are marked by the corresponding colors: sp2 – violet, sp3 – blue. Labels “ob” and “fb” are set by the program to carbon atoms for which neighboring with heteroatom is either obligatory (ob) or forbidden (fb). HMBC connectivities are marked by green arrows, while COSY connectivities – by blue arrows
The experience gained in determining structures similar to 1 has shown that without the introduction of additional structural constraints, the number of generated structures and the generation time can be unacceptably high.
Therefore, 4 carbonyl groups (C 173.6, C 171.8, C 170.5, and C 170.3) were manually drawn in the MCD, and two methyl groups (C 55.00) were connected with oxygen atoms. The multiplicity of signals in the 1H spectrum has also been introduced (see Table 1), which usually results in reducing the generation time.
Logical analysis of MCD showed that there were no contradictions in 2D NMR data, and strict structure generation was initiated. However, after some time, the process was stopped, as it turned out that it would be too long.
It became evident that it was necessary to introduce new constraints, choosing them in such a way as to avoid losing the correct structure.
First run.
Since the two CH3 41.50 (2.39) groups have the same 13C and 1H chemical shifts which are characteristic for CH3-N, it can be assumed that they are attached to a single nitrogen atom. Therefore, a N,N- dimethyl group was drawn on the MCD (Figure 2) , and structure generation was re-initiated. It was completed in 1.5 hour with the following result: k = 573,376 → (Structure Filtering) → 2097 → (Duplicate Removal) → 36.
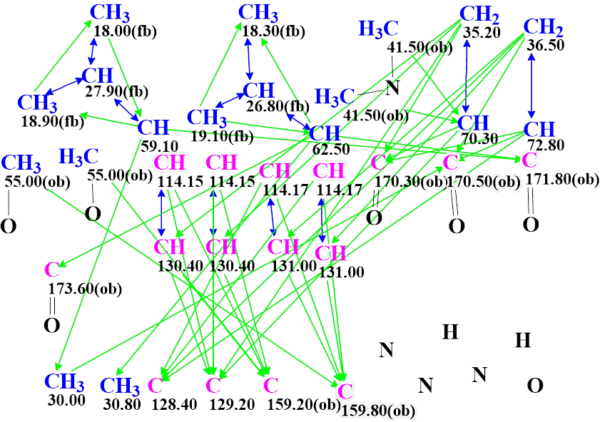
Figure 2. Molecular connectivity diagram of hectoramide B for the first run.
After predicting the chemical shifts of carbon atoms using the three methods available in the program, the structures were ranked in ascending order of average deviations.
The first six structures of the ranked file are shown in Figure 3.

Figure 3. Run 1. The six top ranked structures of the output file. 13C chemical shift prediction was carried out using the HOSE code-based method, the neural networks, and the incremental approach. Average deviations of 13C chemical shifts determined by these methods are denoted as dA, dN and dI correspondingly. Each atom is colored to mark a difference between its experimental and calculated 13C chemical shifts. The green color represents a difference between 0 to 3 ppm, yellow was > 3 to 15 ppm, red > 15 ppm.
As can be seen in Figure 3, the best structure is identical to structure 1, and the calculated values of chemical shifts almost completely coincide with the experimental ones (all carbon atoms are colored green). In this case, the accuracy of the prediction is even higher than that which is usually achieved by DFT. It is evident that the structure of compound 1 was determined with a high degree of reliability. The high accuracy of predicting chemical shifts with empirical methods is explained by the fact that the ACD/Labs predictor training database contains a large number of peptide structures.
Second run.
Another constraint could be introduced in MCD based on the structural information contained in the infrared spectrum. Unfortunately, the IR spectrum was not available from the Supplementary Information to the article [1]. Since the molecule contains a primary amino group and has no hydroxyl groups, it can be expected that the presence of the NH2 group in the molecule could be determined by detecting a doublet in the region of 3400 – 3500 cm-1. Based on this assumption, we connected two hydrogen atoms to a nitrogen atom in the MCD. In order to evaluate the informative value of this assumption only, the bonds between the methyl groups in the N,N- dimethyl group were removed (see MCD in Figure 4).
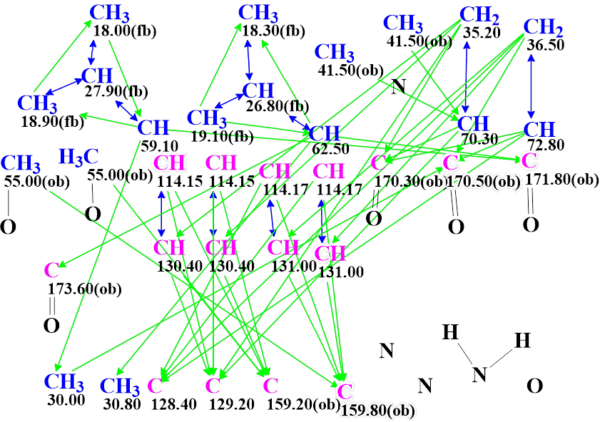
Figure 4. Molecular connectivity diagram of hectoramide B for the second run.
In this case, the generation process ended in 12 minutes, that is 8 times faster in comparison with the time consumed earlier. It gave the following result: k = 492,260 → 925 → 20. The first six structures of the ranked file are shown in Figure 5, and as we see, the best structure is the same.

Figure 5. Run 2. The six top ranked structures of the output file. 13C chemical shift prediction was carried out using the HOSE code-based method, the neural networks, and the incremental approach. Average deviations of 13C chemical shifts determined by these methods are denoted as dA, dN and dI correspondingly. Each atom is colored to mark a difference between its experimental and calculated 13C chemical shifts. The green color represents a difference between 0 to 3 ppm, yellow was > 3 to 15 ppm, red > 15 ppm.
Third run.
When both additional structural constraints were imposed simultaneously (see MCD in Figure 6), structure generation was completed in 4.5 minutes, and 20 structures were generated as in previous run: k = 193,791 → 925 → 20.
This is 20 times faster than in the first run when the presence of only the N(CH3)2 group was considered. The top ranked structures are presented in Figure 7 which confirmed the selected structure chosen at previous program runs.

Figure 6. Molecular connectivity diagram of hectoramide B for the third run.
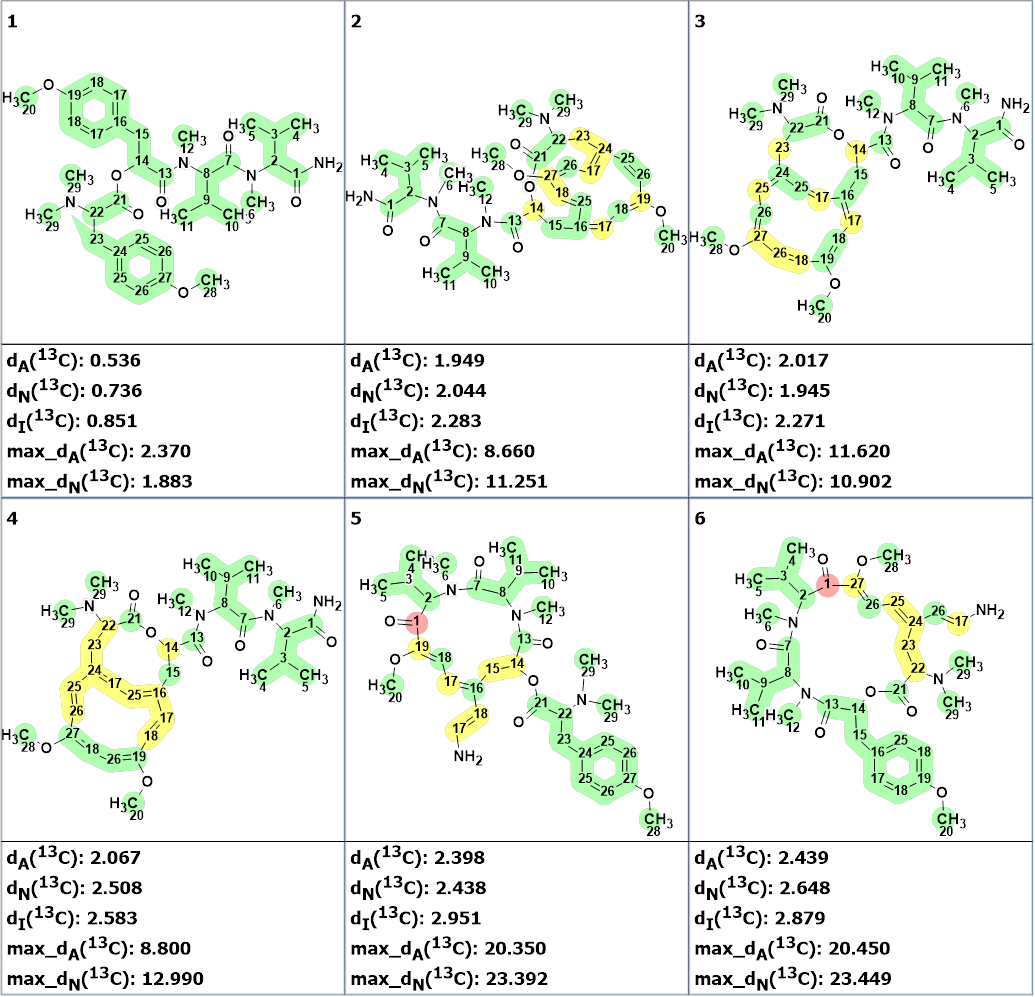
Figure 7. Run 3. The six top ranked structures of the output file. 13C chemical shift prediction was carried out using the HOSE code-based method, the neural networks, and the incremental approach. Average deviations of 13C chemical shifts determined by these methods are denoted as dA, dN and dI correspondingly. Each atom is colored to mark a difference between its experimental and calculated 13C chemical shifts. The green color represents a difference between 0 to 3 ppm, yellow was > 3 to 15 ppm, red > 15 ppm.
This example shows that introducing minor structural constraints can turn a challenging problem into one that which is solved in a few minutes. It is interesting that the most informative constraint (NH2) followed from the characteristic features in the IR spectrum. Unfortunately, NMR spectroscopists frequently ignore IR spectra.
References
- T-E. Ngo, A. Ecker, A. Guild, A. Remmel, P.D. Boudreau, K.L. Alexander, C.B. Naman, E. Glukhov, N.E. Avalon, V.V. Shende, L. Gerwick, W.H. Gerwick. Structure and Biosynthesis of Hectoramide B, a Linear Depsipeptide from the Marine Cyanobacterium Moorena producens JHB Discovered via Co-culture with Candida albicans. bioRxiv preprint, posted July 6, 2023. https://doi.org/10.1101/2023.07.06.547815
About the Author