June 28, 2023
by Mikhail Elyashberg, Leading Researcher, ACD/Labs
Plebeianiol A
Liang, Wu, and coworkers [1] disclosed a phytochemical study of Salvia plebeia R. Br. in 2015. In it, a novel, highly oxidized abietane, plebeianiol A, was isolated and was assigned with structure 1.
1
Recently Vanderwal and coworkers [2] revised this structure and confirmed the revision by total synthesis. The need for structure revision was explained by the following arguments: The authors of [1] showed that plebeianiol A has radical-scavenging properties and inhibits the production of both reactive oxygen species and nitric oxide. Based on 2D NMR experiments, the authors proposed a structure with the canonical octahydrophenanthrene abietane substructure having hydroxyl groups in carbons with chemical shifts 81.8, 66.8, 65.3, and 143 ppm, which are often found to be oxidized in abietane compounds. In an unusual twist the authors proposed the presence of an isopropyl group on the B ring at the carbon at 26.4 ppm and a phenolic hydroxyl group in the location typical of the abietane isopropyl group at the carbon at 141.6 ppm. The authors noted that this proposal was unusual given the typical structures of abietane natural products (Figure 1) but nonetheless proposed a highly unusual biosynthesis of this compound.
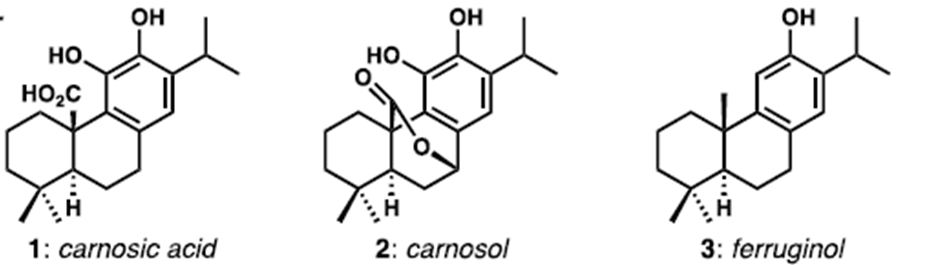
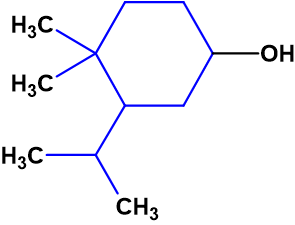
Figure 1. Typical structures of abietane natural products
On these grounds and after careful re-examination of the NMR spectral data reported for plebeianiol A, Vanderwal and coworkers [2] were led to conclude that the structure had likely been misassigned and might, in fact, be 2, with the typical features of an abietane diterpenoid.
2
Liang and coworkers had previously isolated a related abietane (3) from Ajuga forrestii, to which 2 is likely a biosynthetic precursor.
3
The authors of [2] assumed that a similar approach could be followed to access the proposed revised structure of plebeianiol A (2) and in doing so correct its structure. As a result, structure 2 was synthesized, and its NMR spectra shown to be identical with those presented in article [1].
The comparison of structures 1 and 2 shows that the authors [1] incorrectly interpreted at least two peaks in the HSQC spectrum: the quaternary carbon at 126.3 ppm and the methylene group at 31.7 ppm were attributed as CH’s. Obviously, the correct structure could not be deduced from these NMR data.
As shown by [3-6], ACD/SE is a powerful tool for the revision of incorrectly determined structures. Many corrections of erroneous structures published in the literature have been made with the help of this expert system. NMR spectra taken from the corresponding original articles are introduced into the program, which usually allows to find the right solution to the problem. The cause for the publication of an incorrect structure is most often the erroneous interpretation of HMBC data.
We were interested to know what the result of using ACD/SE for the revision of the plebeianiol A structure would be if the NMR data presented in the work of Liang and collaborators [1] were used for this.
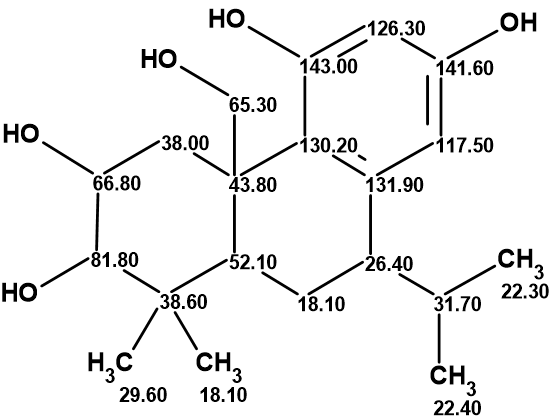
Structure 1 was introduced into the Proposed Structure (PS) window of ACD/SE and verified by 13C chemical shift prediction using three empirical methods provided for in ACD/SE. The results are shown in Figure 2.
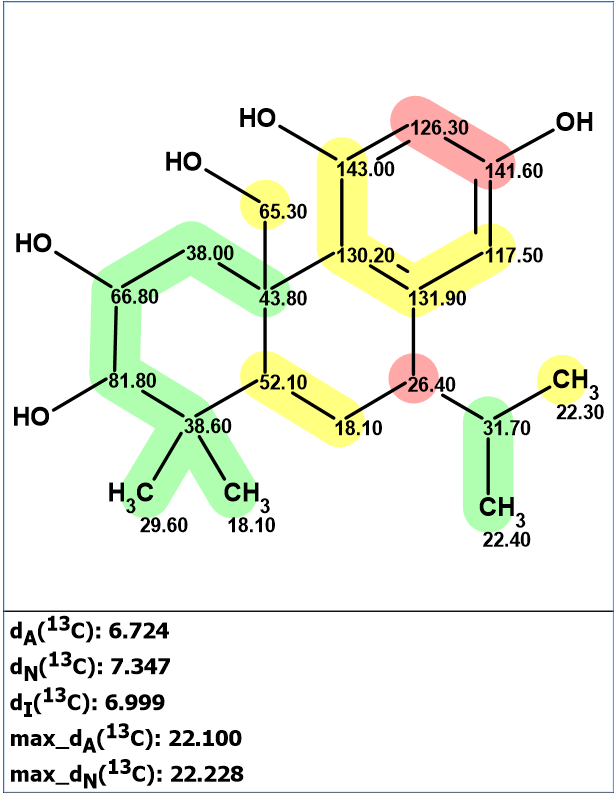
Figure 2.The structure of plebeianiol A (1) proposed by Liang et al [1 for which 13C chemical shift prediction was carried out using the HOSE code-based method, the neural networks, and the incremental approach. The average deviations of 13C chemical shifts determined by these methods are denoted as dA, dN and dI correspondingly. Each atom is colored to mark a difference between its experimental and calculated 13C chemical shifts. The green color represents a difference between 0 to 3 ppm, yellow was >3 to 15 ppm, red >15 ppm.
We see that the average and maximum deviations calculated for structure 1 are very large, which is evidence of structure error. Note that this conclusion was made without any chemical considerations. The next step should be an attempt to find the most probable structure that could be contingent from the NMR data presented in [1]. These data included a table of 13C and 1H chemical shifts associated with carbon atoms for which numbers of attached hydrogens were determined. Only some key correlations from the HMBC spectrum were drawn on the picture of the supposed structure 1. This spectroscopic information is summarized in Table 1.
| C Label | C | XHn | H | H to C HMBC |
| C 1 | 38.6 | C | ||
| C 2 | 81.8 | CH | 2.84 | C 16, C 15 |
| C 3 | 66.8 | CH | 3.57 | C 2 |
| C 4 | 38 | CH2 | 3.36 | |
| C 5 | 43.8 | C | ||
| C 6 | 130.2 | C | ||
| C 7 | 143 | C | ||
| C 8 | 126.3 | CH | 6.53 | C 10 |
| C 9 | 141.6 | C | ||
| C 10 | 117.5 | CH | 6.35 | C 9 |
| C 11 | 131.9 | C | ||
| C 12 | 26.4 | CH | 3.1 | C 18, C 19 |
| C 13 | 18.2 | CH2 | 1.6 | |
| C 13 | 18.2 | CH2 | 1.5 | |
| C 14 | 52.1 | CH | 1.3 | C 6 |
| C 15 | 29.6 | CH3 | 1.01 | C 16, C 1, C 14 |
| C 16 | 18.1 | CH3 | 0.78 | C 15, C 1, C 14 |
| C 17 | 31.7 | CH | 2.74 | C 13, C 11 |
| C 18 | 22.3 | CH3 | 1.1 | C 19, C 12 |
| C 19 | 22.4 | CH3 | 1.11 | C 18, C 12 |
| C 20 | 65.3 | CH2 | 3.73 | C 4 |
| C 20 | 65.3 | CH2 | 4.12 | C 5, C 6 |
Though the low resolution of the HSQC spectrum is shown in SI to [1] does not allow analyzing the spectrum in detail, it is clear that there is no signal of the cross peak 126.3/6.53 ppm. Nevertheless, to verify the consequences from the authors “axioms”, the data presented in Table 1 and the molecular formula C20H30O5 were entered into ACD/SE, and a Molecular Connectivity Diagram (MCD) was created (Figure 3).
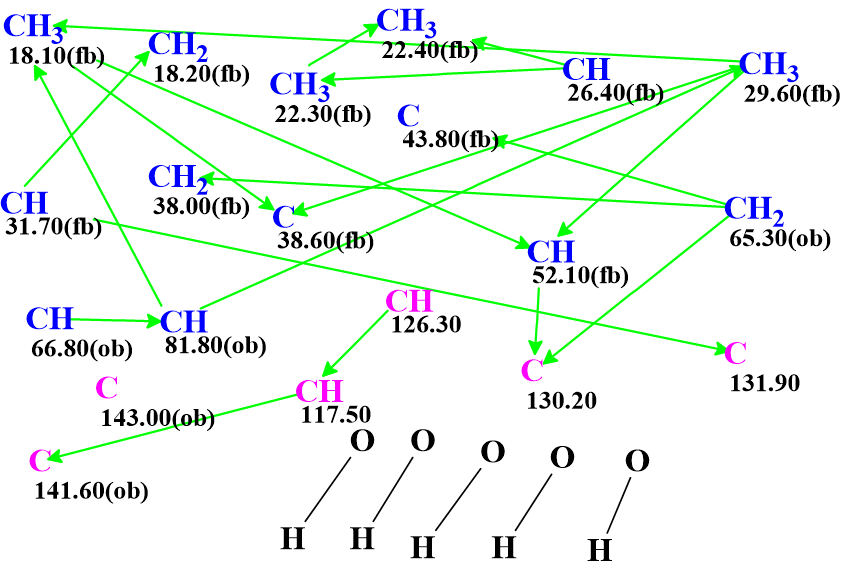
Figure 3. Molecular connectivity diagram (MCD) of plebeianiol A. Hybridizations of carbon atoms are marked by the corresponding colors: sp2 – violet, sp3 – blue. Labels “ob” and “fb” are set by the program to carbon atoms for which neighboring with heteroatom is either obligatory (ob) or forbidden (fb). HMBC connectivities are marked by green arrows.
It is expected that number of generated structures will be large because the MCD contains a quaternary atom at 143.0 ppm having no HMBC correlations. Structure generation accompanied with 13C chemical shift prediction and structural filtering was initiated, which was completed with the following results: k = 90,470 → (spectral and structural filtering) → 5,897 → (filtering by Bredt’s rule) → 4,497 → (duplicate removal) → 2,291, tg =3 m 50 s.
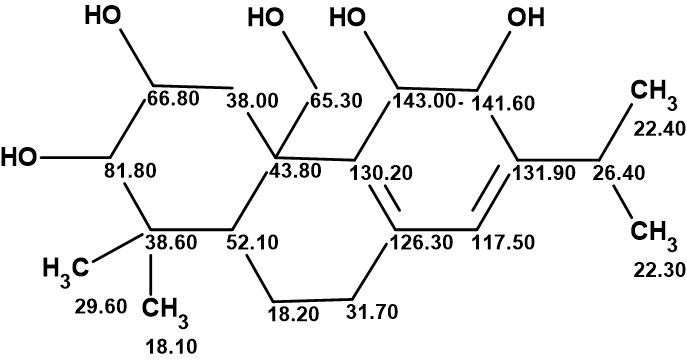
The six top structures of the output file ranked in increasing order of 13C chemical shift deviations are shown in Figure 4.
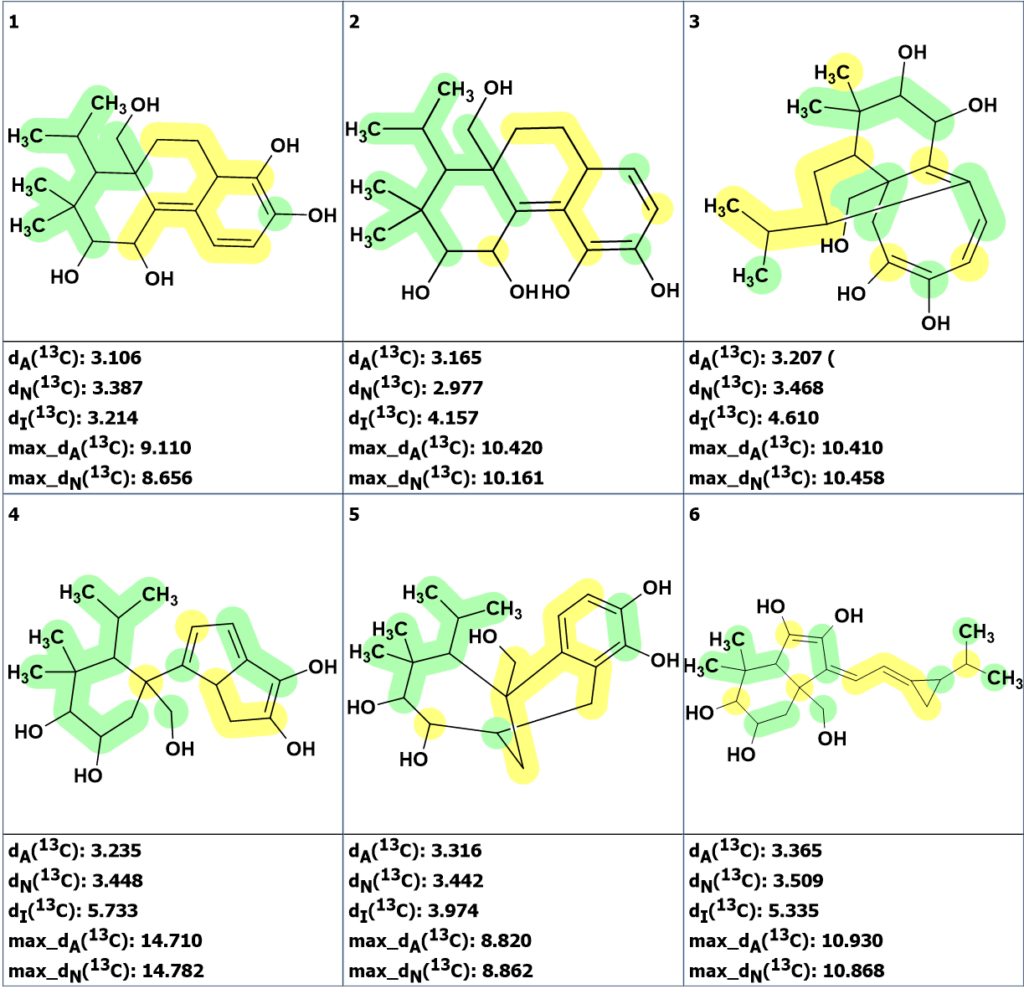
Figure 4. The six top ranked structures of the output file.
The figure shows that the best structures have average deviations two times smaller than structure 1 had (Figure 2), but they still exceed the deviation values which are typical for correct structures. In addition, the possibility of dimethyl and isopropyl groups neighboring as substituents at cyclohexane ring in a natural product is not evident: for instance, only one structure possessing this property was found among 226,000 items included into NMR DB:
We can conclude that no acceptable structure can be logically deduced from the NMR data published in [1]. To find the correct solution, it is necessary to revise the NMR data. However, it was impossible in our case because neither authors of [1] nor of [2] presented full NMR data.
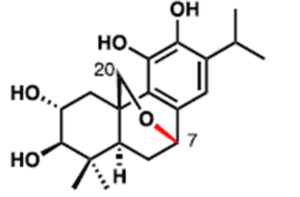
Taking this into account, we made the corrections to HSQC and HMBC data (see Table 1) according to 2 and repeated the structure generation. The structures obtained did not make chemical sense and also had large deviations. From this we can conclude that in reality not all HMBC correlations noted by the authors as key ones have a standard length (2-3 chemical bonds). In this regard, an attempt was made to perform fuzzy structure generation, allowing for the presence of one nonstandard HMBC correlation, the length of which is unknown. As one might expect, the generation was very long. It was stopped after 2 hours, when a message was received from the program that structure 2 was generated (this structure was in the PS window during the generation). For 2 hours, the program produced ~3,900,000 structures, of which 18,427 were included in the output file. The first 6 structures of the ranked output file are shown in Figure 5.
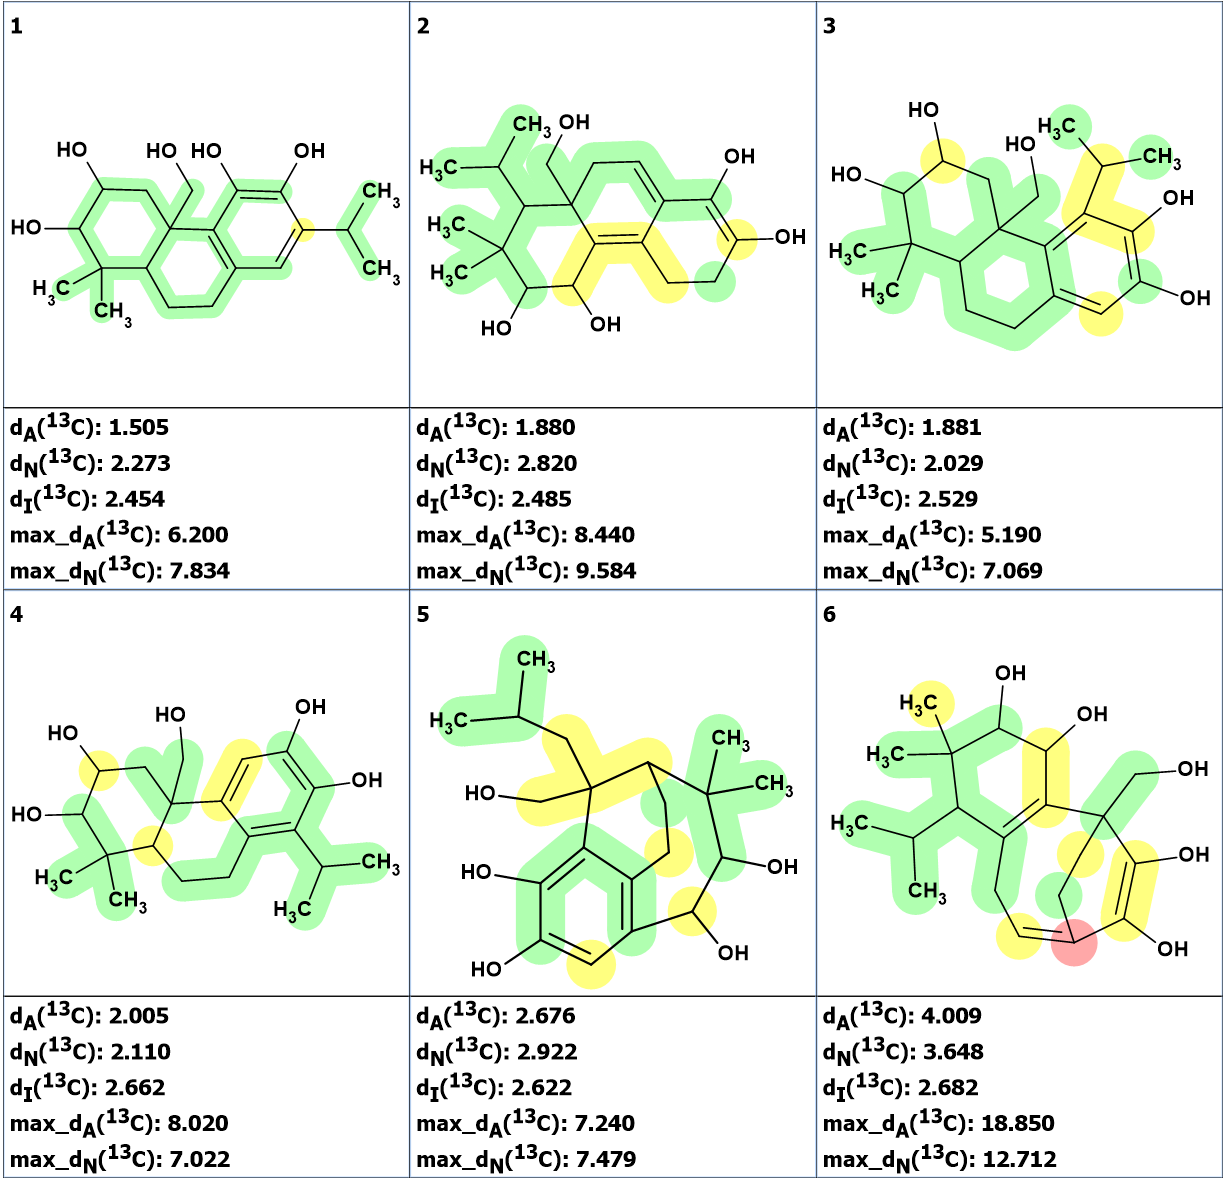
Figure 5. The first 6 structures of the ranked output file produced using fuzzy structure generation.
The figure shows that the best structure, #1, is identical to the revised structure 2 that was confirmed by chemical synthesis. To compare the chemical shift assignments, both structures, 2 and #1, revised by using the two methods are shown in Figure 6.
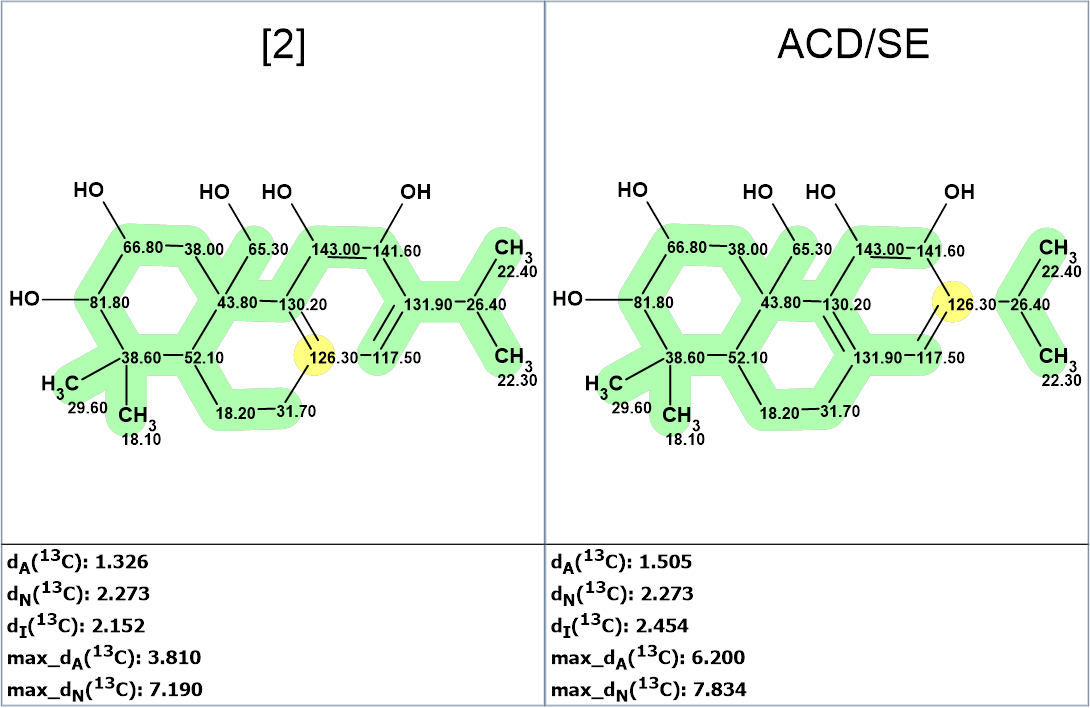
Figure 6. Comparison of chemical shift assignments for structure 2 and the best hit suggested by ACD/SE.
We see that both structures have similar deviations and differ only in the permutation of two chemical shifts -126.3 and 131.9 ppm.
From this example, it can be concluded that the use of ACD/SE made it possible to confidently establish the error of structure 1 and to show that it is impossible to derive any acceptable structure from the published NMR spectra. After correction of the HSQC fuzzy structure generation helped to overcome the uncertainty of HMBC data and identify the correct structure, although the generation process was stopped before it was completed. Obviously, based on relevant and complete NMR data (only the HMBC correlations which the authors [1] declared to be key ones were available), the correct structure would be found by the program in a routine mode and at a short time.
References
- Zhang, B.-B.; He, B.-Q.; Sun, J.-B.; Zeng, B.; Shi, X.-J.; Zhou, Y.; Niu, Y.; Nie, S.-Q.; Feng, F.; Liang, Y.; Wu, F.-H. (2015). Diterpenoids from Saliva plebeia R. Br. and Their Antioxidant and Anti-Inflammatory Activities. Molecules, 20(8), 14879-14888.
- L. K. Johnson, S.W. Niman, D. Vrubliauskas, C.D. Vanderwal. (2021). Stereocontrolled Synthesis and Structural .Revision of Plebeianiol A. Org. Lett., 23, 9569−9573.
- M. Elyashberg, A. Williams, K. Blinov. (2010). Structural revisions of natural products by Computer Assisted Structure Elucidation (CASE) Systems. Nat. Prod. Rep., 27(9), 1296-1328.
- M. Elyashberg, K. Blinov, S. Molodtsov, A.J. Williams. (2013). Structure Revision of Asperjinone Using Computer-Assisted Structure Elucidation Methods., J. Nat. Prod., 76, 113−116.
- M. Elyashberg, I. M. Novitskiy, R. Bates, A. G. Kutateladze, C. M. Williams. (2022). Reassignment of Improbable Natural Products Identified through Chemical Principle Screening. Eur. J. Org. Chem., e202200572. https://doi.org/10.1002/ejoc.202200572
- Elyashberg, M.; Tyagarajan, S.; Mandal, M.; Buevich, A. V. (2023). Enhancing Efficiency of Natural Product Structure Revision: Leveraging CASE and DFT over Total Synthesis. Molecules, 28(9), 3796.
About the Author