July 31, 2023
by Mikhail Elyashberg, Leading Researcher, ACD/Labs
Aspochalasin H1
Aspergillus, a widely researched fungal genus in endophytes, stands out as a dominant presence. The Aspergillus genus, as reported by The World Data Centre for Microorganisms (WDCM), encompasses approximately 380 species. Within the timeframe of 2015–2019, over 350 new fungal metabolites were identified, further establishing these filamentous fungi as an abundant and diverse source of bioactive secondary metabolites with significant chemical and biological variations. In the study described by Quader et al [1], a new natural product, aspochalasin H1 (1), together with nine known compounds, were isolated from a Hawaiian plant-associated endophytic fungus Aspergillus sp. FT1307.
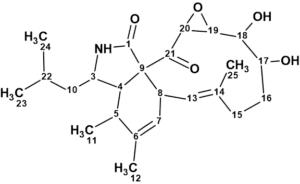
1
The structure of aspochalasin H1 was elucidated using 1D and 2D NMR (1H-1H COSY, HSQC, HMBC, ROESY and 1D NOE), high-resolution electrospray ionization mass spectroscopy (HRESIMS), and comparisons with the reported literature.
Compound 1 was obtained as an oil. The molecular formula C24H35NO5 with eight degrees of unsaturation was established by the positive mode quasi-molecular ion peaks at m/z 418.2592 for [M + H] + (calcd. 418.2593 for C24H36NO5) and m/z 440.2398 for [M + Na] + (calcd. 440.2413 for C24H35NO5Na) in combination with its NMR data.
The molecular formula and NMR spectroscopic data of aspochalasin H1 (Table 1) were entered into ACD/Structure Elucidator.
Table 1. NMR spectroscopic data of aspochalasin H1
| C Label | C | Ccalc (HOSE) | CHn | H | COSY | H to C HMBC |
| C 1 | 174.6 | 176.48 | C | |||
| C 3 | 51.6 | 55.38 | CH | 3.1 | 1.29, 2.64 | |
| C 4 | 52.9 | 54.02 | CH | 2.64 | 2.60, 3.10 | C 3, C 9, C 1 |
| C 5 | 35.4 | 36.54 | CH | 2.6 | 2.64 | C 4, C 9, C 6 |
| C 6 | 140.6 | 140.78 | C | |||
| C 7 | 125.6 | 126.83 | CH | 5.39 | 3.02 | |
| C 8 | 43.8 | 43.79 | CH | 3.02 | 5.39, 6.04 | C 21 |
| C 9 | 68.4 | 67.8 | C | |||
| C 10 | 48.8 | 50.29 | CH2 | 1.29 | 1.56, 3.10 | C 24, C 22, C 3 |
| C 11 | 13.7 | 18.03 | CH3 | 1.21 | C 4, C 6 | |
| C 12 | 20.1 | 20.1 | CH3 | 1.76 | C 7, C 14, C 6 | |
| C 13 | 125.2 | 125.02 | CH | 6.04 | 3.02 | |
| C 14 | 135.6 | 136.67 | C | |||
| C 15 | 38.8 | 37.64 | CH2 | 2.29 | 1.63 | C 13 |
| C 15 | 38.8 | 37.64 | CH2 | 2.1 | ||
| C 16 | 31 | 30.08 | CH2 | 1.76 | ||
| C 16 | 31 | 30.08 | CH2 | 1.63 | 2.29, 3.78 | |
| C 17 | 70.8 | 71.5 | CH | 3.78 | 1.63, 3.80 | |
| C 18 | 73.7 | 69.01 | CH | 3.8 | 2.82, 3.78 | C 17 |
| C 19 | 60.5 | 57.97 | CH | 2.82 | 3.8 | C 18 |
| C 20 | 52.2 | 55.92 | CH | 4.4 | C 19 | |
| C 21 | 208 | 203.04 | C | |||
| C 22 | 25.2 | 26.07 | CH | 1.56 | 0.90, 0.91, 1.29 | |
| C 23 | 23.7 | 22.92 | CH3 | 0.91 | 1.56 | C 10 |
| C 24 | 21.4 | 22.92 | CH3 | 0.9 | 1.56 | C 23 |
| C 25 | 15.5 | 15.87 | CH3 | 1.42 | C 15, C 13, C 14 |
The Molecular Connectivity Diagram (MCD) created by the program is presented in Figure 1.
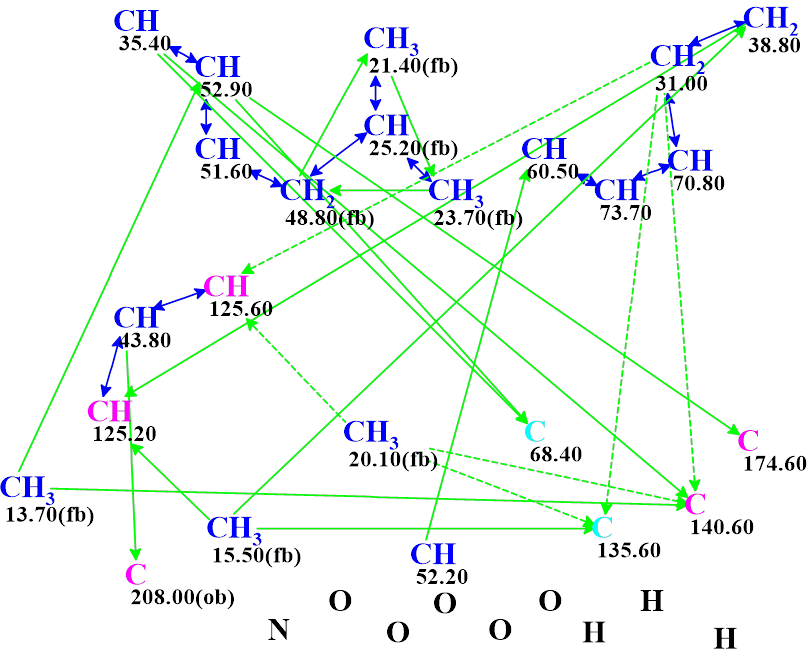
Figure 1. Molecular connectivity diagram (MCD) of aspochalasin H1. The hybridizations of carbon atoms are marked by the corresponding colors: sp2 – violet, sp3 – blue, not sp (sp2 or sp3) – light blue. The labels “ob” and “fb” are set by the program to carbon atoms for which neighboring with heteroatom is either obligatory (ob) or forbidden (fb). HMBC connectivities are marked by green arrows, while COSY connectivities by blue arrows. Ambiguous connectivities are marked by dotted lines. The ambiguous connectivities are accounted for by the presence of two identical 1H chemical shifts 1.76 ppm (marked by red font in Table 1) assigned to protons which are attached to carbons CH3 (20.1) and CH2 (31.0)
No edits were done for the data presented in the MCD, and structure generation accompanied by 13C chemical shift prediction and structural filtering was initiated. Results: k = 10,006 → (Filter) → 787 → (Duplicate removal) → 787, tg = 38 s. The structures of the output file were ranked in increasing order of average deviations of calculated 13C chemical shifts from the experimental ones. The six top ranked structures are presented in Figure 2.
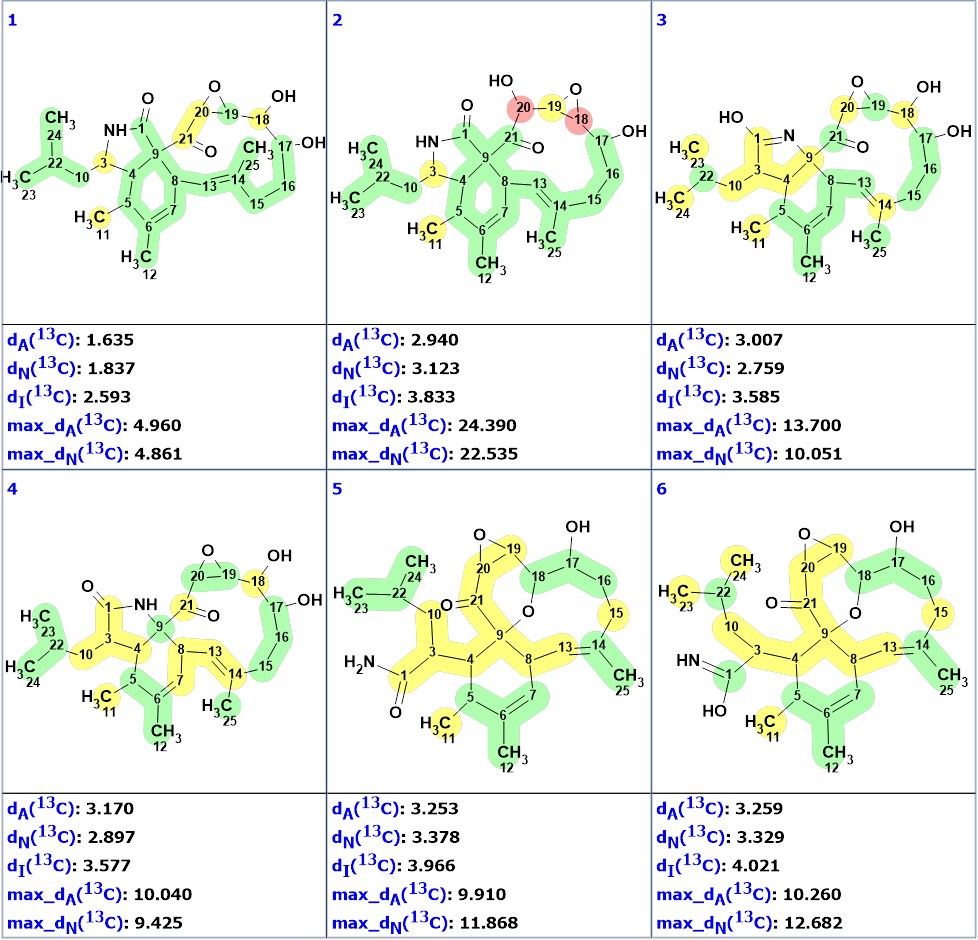
Figure 2. The ranked output file. 13C chemical shift prediction was carried out using the HOSE code-based method, the neural networks, and the incremental approach. Average deviations of 13C chemical shifts determined by these methods are denoted as dA, dN and dI correspondingly. Each atom is colored to mark a difference between its experimental and calculated 13C chemical shifts. The green color represents a difference between 0 to 3 ppm, yellow was >3 to <15 ppm and red > 15 ppm.
Figure 2 shows that the best structure of the ranked file (#1) is identical to the structure of aspochalasin H1 deduced by the authors [1]. Although all other structures are similar to structure 1, they are characterized with larger averaged and maximum deviations, which confirms the reliability of the found solution to the problem.
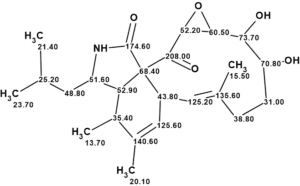
Thus, the CASE-based structure elucidation was carried out automatically without any user intervention in half a minute. The structure of aspochalasin H1 with 13C chemical shift assignments is shown below:
References
- M. Qader, K. A. U. Zaman, Z. Hu , C. Wang, Xi. Wu, S. Cao. (2021). Aspochalasin H1: A New Cyclic Aspochalasin from Hawaiian Plant-Associated Endophytic Fungus Aspergillus sp. FT1307. Molecules, 26, 4239. https://doi.org/10.3390/molecules26144239
About the Author