October 1, 2013
by Mikhail Elyashberg, Leading Researcher, ACD/Labs
Aquatolide
Aquatolide is a humulane-derived sesquiterpenoid lactone isolated from Asteriscus aquaticus. The structure (1a) originally proposed on the basis of 1D and 2D NMR analysis [1] contains an exceedingly rare [2] ladderane substructure.
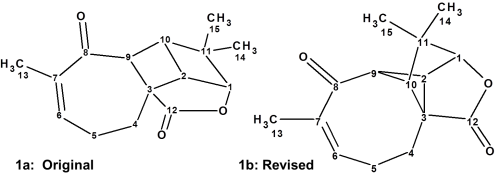
Intrigued by this structural unit, Lodevyk and co-workers [2] initiated quantum-chemical NMR calculations to verify the reported connectivity. These calculations led the authors [2] to extensive structural revision of this complex natural product. As a result of the quantum-chemical (QM) calculations of the 13C and 1H chemical shifts and associated coupling constants for a series of possible structures, it was shown that the true structure of Aquatolide was 1b. This required the calculation of chemical shifts for 60 different possible alternative structures, largely based on other related compounds found in the same plant. We have historically taken great interest [3,4] in structure revision problems, and we were intrigued by this application of a different approach. Here we apply a well-established Computer Assisted Structure Elucidation (CASE) method to the problem, in order to compare results with the QM method.
1H–13C HMBC data were directly extracted from the tabulated 1D NMR and HSQC data and the HMBC spectrum pattern presented in the Supporting Information of article [2] (Figure 1). The NMR spectroscopic data of Aquatolide are presented in Table 1, and the corresponding Molecular Connectivity Diagram (MCD) is displayed in Figure 2.
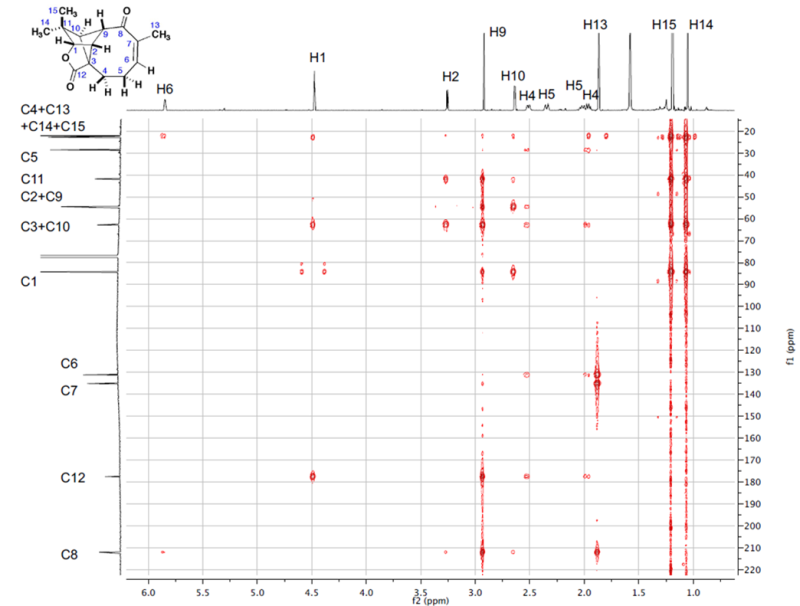
Figure 1: HMBC spectrum of Aquatolide.
Table 1. Spectroscopic NMR data for Aquatolide.
| Label | δC | δC calc | CHn | δH | M(J) | C HMBC |
| C 1 | 84.20 | 87.69 | CH | 4.48 | u | C 12, C 15, C 3, C 10, C 14 |
| C 2 | 54.54 | 49.01 | CH | 3.26 | u | C 11, C 8, C 3, C 10 |
| C 3 | 62.83 | 54.68 | C | |||
| C 4 | 22.15 | 31.27 | CH2 | 1.96 | u | |
| C 4 | 22.15 | 31.27 | CH2 | 2.52 | u | C 2, C 6, C 10, C 12, C 3, C 5 |
| C 5 | 28.63 | 23.36 | CH2 | 2.35 | u | |
| C 5 | 28.63 | 23.36 | CH2 | 2.03 | u | |
| C 6 | 131.10 | 143.34 | CH | 5.85 | u | C 4, C 13, C 8 |
| C 7 | 135.08 | 136.93 | C | |||
| C 8 | 211.94 | 199.27 | C | |||
| C 9 | 54.45 | 51.52 | CH | 2.92 | u | C 8, C 7, C 1, C 10, C 2, C 3, C 11 |
| C 10 | 62.59 | 49.53 | CH | 2.64 | u | C 11, C 1, C 15, C 8, C 2, C 9, C 14, C 4 |
| C 11 | 41.86 | 40.09 | C | |||
| C 12 | 177.50 | 176.04 | C | |||
| C 13 | 22.22 | 19.56 | CH3 | 1.87 | u | C 7, C 8, C 6 |
| C 14 | 22.62 | 12.31 | CH3 | 1.05 | u | C 15, C 1, C 11, C 10 |
| C 15 | 22.84 | 22.77 | CH3 | 1.19 | u | C 11, C 14 |
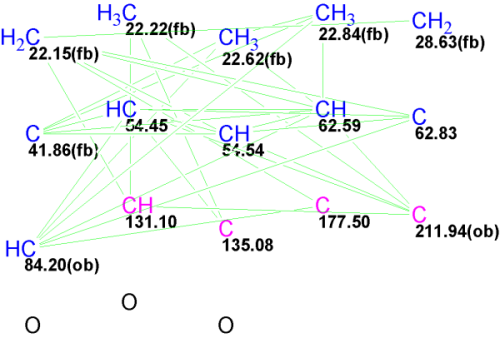
Figure 2: The Molecular Connectivity Diagram for Aquatolide. sp3 carbons are indicated in blue; sp2 are indicated in violet; (fb) denotes that chemical bonds with heteroatom are forbidden; (ob) denotes the bond with a heteroatom is obligatory; and green lines denote connectivities between carbon atoms.
No edits of the MCD were made. As no contradictions were detected in the 2D NMR data, strict structure generation was performed with the following results: k=3→3, tg=0.05 s. The three generated structures along with their 13C and 1H deviations as well as the maximum 13C deviations are shown in Figure 3.
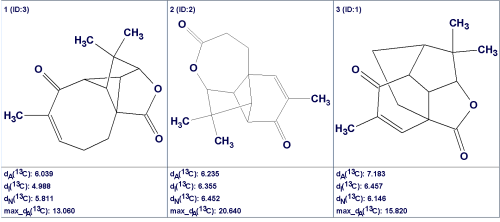
Figure 3: The structural output file for Aquatolide ranked by average deviations dA(13C) along with deviations dI(13C) and dN(13C) found for different methods of 13C chemical shift prediction: dA—HOSE based, dI—Incremental method, dN—Neural Nets based approach.
The first observation that can be made is the absence of the original structure 1a in the output file. Therefore, utilizing the CASE approach initially would prevent the generation of an erroneous structural hypothesis.
The first ranked structure is identical to the revised structure 1b, though its deviation values are significantly higher than those usually obtained. This is likely a result of the very unusual skeleton for 1b, for which there is a lack of associated structures in the prediction databases. Specifically, only single hits were found in the ACD/CNMR database to assist in the prediction of each of the chemical shifts at 22.15, 131.1, and 211.94 ppm. Figure 4 shows the chemical shift distributions displayed in the calculation protocols which were generated to explain the predicted chemical shift values calculated for C 22.15 (5 hits) and C 62.83 (22 hits). The distributions clearly demonstrate the reasons for the discrepancies between the experimental and calculated chemical shifts.
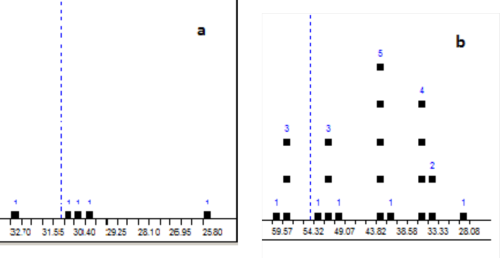
Figure 4: The calculation protocols associated with Aquatolide, generated to explain the predicted chemical shift values calculated for C 22.15 (5 hits, a) and C 62.83 (22 hits, b). Vertical dashed lines indicate positions of the predicted chemical shifts.
The superiority of structure #1 over other structures is not so significant when judged using the average 13C deviation values. Nevertheless, the maximum 13C shift deviations and the average deviations calculated for the 1H chemical shifts using incremental and neural nets approaches also supports the priority ranking of the revised structure 1b. The quantum-chemical calculations play a decisive role in distinguishing the preferable structure among the three candidates illustrated in Figure 4. Note that in this case the quantum-chemical chemical shift calculations would be performed only for three molecules, but not for the sixty as performed by the authors [2].
Figure 5 shows the revised and original structures along with the calculated deviation values.
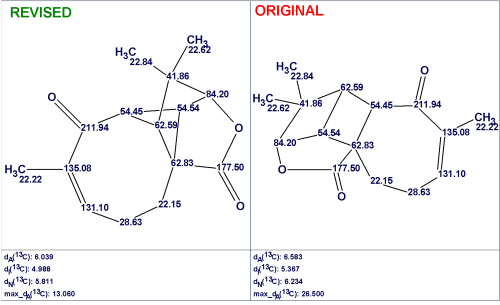
Figure 5: The revised and original structures of Aquatolide with the assigned 13C chemical shifts and calculated 13C and 1H chemical shift deviations.
Both the average and maximum 13C chemical shift deviations indicate the assignment of the revised structure as the most probable (Figure 5). 1H chemical shift deviations cannot be used for supporting the priority of the revised structure in this case as the accuracy of 1H chemical shift prediction is lower than the accuracy of 13C chemical shift calculation; hence, 1H deviations play a secondary role in CASE.
For completeness it was interesting to investigate why the original structure 1a was not generated by the program. Two possible reasons seem to be most probable: either structure 1a was rejected by the filter or it was not produced by the generator due to contradictions in the HMBC data (i.e., presence of non-standard correlations) that prevented its generation. The structure was checked using HMBC data, and as a result three 4JHC non-standard correlations were detected as shown by the red arrows below:
Therefore to generate this structure it would be necessary to initiate Fuzzy Structure Generation with the parameters m=3, a=1.
Conclusions
The revised structure was found quickly using well-established CASE methods, based on experimentally derived connectivity and empirical shift calculations; the original erroneous structure was never generated. The process took a very limited amount of time and effort. Such CASE methods are excellent both for standard structure characterization and for more complex elucidation. It would be feasible to apply these methods more broadly.
References
- San Feliciano, A.; Medarde, M.; Miguel del Corral, J. M.; Aramburu, A.; Gordaliza, M.; Barrero, A. F. Tetrahedron Lett., 30:2851, 1989.
- M. W. Lodewyk, C. Soldi, P.B. Jones, M.M. Olmstead, J. Rita, J. Shaw, D. J. Tantillo. J. Am. Chem. Soc., 134(45):18550, 2012.
- M.E. Elyashberg, A.J. Williams, Blinov K.A. Contemporary Computer-Assisted Approaches to Molecular Structure Elucidation, Cambridge, RSC Publishing, p482, 2012.
- M. Elyashberg, A. Williams, K.Blinov. Structural revisions of natural products by Computer Assisted Structure Elucidation (CASE) Systems. Nat. Prod. Rep., 27(9):1296, 2010.
About the Author