February 1, 2018
by Mikhail Elyashberg, Leading Researcher, ACD/Labs
Aquatolide
Combination of CASE and DFT methods
The efficiency of ACD/Structure Elucidator (SE) has been confirmed over the years by solving a great number of real world problems (almost 1000) related mainly to the structure determination of new natural products. Several such examples have been presented in this Elucidation of the Month column and more are presented in the two books referenced [1,2]. The program output contains all plausible structures for which 13C and 1H (optional) chemical shifts can be calculated by three empirical methods: HOSE (Hierarchical Organization of Spherical Environments) code, neural networks and incremental methods (additivity rules). The structures in the output file are ranked in order of increased discrepancy between experimental and predicted NMR chemical shifts; the top-ranked structure(s) is/are considered the most probable. However, we met some structural problems where SE failed to reliably distinguish the correct structure even though this was produced. There were two kinds of such challenges observed:
- The correct structure is on the first position in a ranked file, but the average deviations of chemical shifts are too large (5-6 ppm)
- The correct structure is either first or among several top-ranked structures with acceptable but very similar deviations
The first challenge is likely due to the lack of relevant structural motifs in the reference database, whereas the second may be due to a high degree of similarity between the top ranked structures. We have shown [3,4] that these shortcomings of empirical methods of NMR chemical shift predictions can be circumvented by the utilization of higher accuracy quantum-mechanical (QM) calculations. Recent progress in these calculations, specifically by the density functional theory (DFT) methods, has opened the opportunity to apply them to medium-sized (20 and more heavy atoms) natural products and synthetic organic molecules with very moderate computational costs. The accuracy of the prediction of chemical shifts by DFT methods has constantly improved over the past decade. Specifically, for natural products and small organic molecule applications, about 250 different DFT methods, which include a diverse set of functionals, basis sets, and solvent models, have been tested in literature. The standard deviations of the chemical shift predictions achieved (less than 0.1 ppm for protons and less than 2 ppm for carbons) provide a sufficient degree of accuracy for the majority of structural problems. In less routine situations, such as in case of molecules with heavy atoms, more rigorous approaches, including relativistic and electron correlation effects, can be applied to further improve the accuracy of chemical shift predictions.
However, DFT methods cannot compete in speed with empirical methods and their routine application in CASE algorithms seems to be unfeasible at the present time [5]. Thus, for an average organic molecule the time required to calculate a single set of chemical shifts by DFT is measured by tens of minutes to hours depending on the level of theory used and available computational resources. In contrast, the number of structures generated during CASE analysis is measured by thousands or even millions [1], and, consequently, the DFT methods of predicting chemical shifts cannot replace empirical methods within CASE systems. It appears logical to suggest that in those cases when CASE empirical calculations fail to definitively converge to a single structure, application of QM based chemical shift prediction on a limited number of top-ranked structures could potentially help to solve this problem. In this case, the selection of structures to be calculated by DFT methods would be done strictly by computer-assisted logical analysis and not by a potentially biased investigator, which ensures that the complete set of all possible isomers satisfying 1D spectra and 2D correlations will be rigorously tested. A combination of CASE and DFT methods has been explored first in [1,2].
In the next few installments of this Elucidation of the Month column of the ACD/Labs site we will present a series of examples demonstrating combined application of CASE and DFT methods for structure elucidation.. The examples will be adopted from the articles [3,4].
Example 1. Aquatolide
The first example [3] used to examine the proposed approach is the structural analysis of aquatolide (C15H18O3). Aquatolide is a humulane-derived sesquiterpenoid lactone isolated from Asteriscus aquaticus. The structure of aquatolide (1), originally proposed on the basis of 1D and 2D NMR analysis [6], contained an extremely rare ladderane substructure.
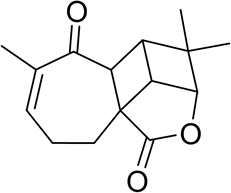
1
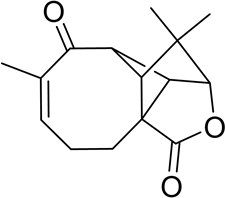
2
Lodewyk and co-workers [7] found significant discrepancies between experimental and DFT-predicted chemical shift values for structure 1. The revised structure of aquatolide 2 was subsequently suggested as an alternative photocyclization product of the potential precursor of aquatolide isolated from the same plant. To further confirm the proposed structure 2, the authors [7] tested ~50 different possible alternative structures, largely based on other related compounds found in the same plant. The most probable structure was selected based on DFT calculations of 13C and 1H chemical shifts and associated coupling constants for all candidates. As a result of these extensive calculations, it was proven that the true structure of aquatolide was 2, which was subsequently confirmed by X-ray crystallography and by total synthesis.
Experimental 13C and 1H NMR data acquired for aquatolide by Lodewyk and co-workers [7] gave us an opportunity to study the effectiveness of the proposed combination of CASE and DFT methods, as well as a chance to verify that the set of possible structures that have been considered in prior investigations was complete and didn’t contradict any of the NMR data.
CASE analysis was initiated with the collection and systematization of available 1D proton and carbon, and 2D NMR COSY, HSQC and HMBC data (see Table 1).
Table 1. Spectroscopic NMR data for aquatolide (2) [7]
| Label | δCexp | CHn | δHexp | JHH, Hz | HMBC (H to C) |
| C 1 | 84.2 | CH | 4.48 | t(2.2) | C 12, C 15, C 3, C 10, C 14 |
| C 2 | 54.54 | CH | 3.26 | dd(7.3, 2.5) | C 11, C 8, C 3, C 10 |
| C 3 | 62.83 | C | |||
| C 4 | 22.15 | CH2 | 1.96 | m | |
| C 4 | 22.15 | CH2 | 2.52 | m | C 2, C 6, C 10, C 12, C 3, C 5 |
| C 5 | 28.63 | CH2 | 2.35 | m | |
| C 5 | 28.63 | CH2 | 2.03 | m | |
| C 6 | 131.1 | CH | 5.85 | ddt(4.7,3.1,1.5) | C 4, C 13, C 8 |
| C 7 | 135.08 | C | |||
| C 8 | 211.94 | C | |||
| C 9 | 54.45 | CH | 2.92 | s | C 8, C 7, C 1, C 10, C 2, C 3, C 11 |
| C 10 | 62.59 | CH | 2.64 | dd(7.3,1.8) | C 11, C 1, C 15, C 8, C 2, C 9, C 14, C 4 |
| C 11 | 41.86 | C | |||
| C 12 | 177.5 | C | |||
| C 13 | 22.22 | CH3 | 1.87 | q(2.0) | C 7, C 8, C 6 |
| C 14 | 22.62 | CH3 | 1.05 | s | C 15, C 1, C 11, C 10 |
| C 15 | 22.84 | CH3 | 1.19 | s | C 11, C 14 |
The spectroscopic data and the molecular formula C15H18O3 were then used by ACD/Structure Elucidator to produce a Molecular Connectivity Diagram (MCD) shown in Figure 1.
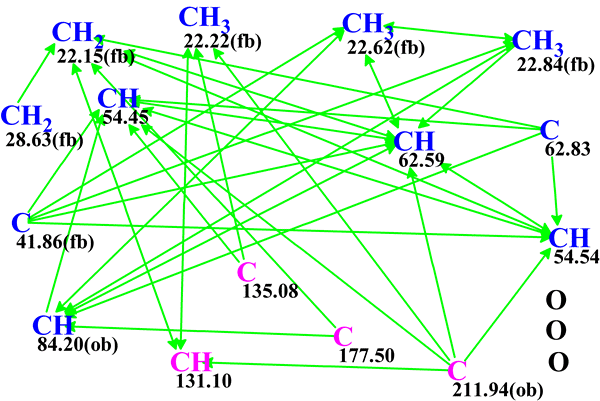
Figure 1. Molecular Connectivity Diagram for aquatolide (C15H18O3). Carbon atoms hybridized as sp3 and sp2 are marked by blue and violet colors, respectively. HMBC connectivities are displayed by green arrows. Labels ob (obligatory) and fb (forbidden) indicate the admissibility of a neighbor heteroatom. Three oxygen heteroatoms are shown in the right lower corner of the diagram for consistency with molecular formula of aquatolide.
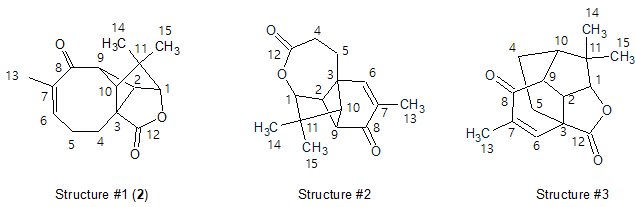
No manual edits of the aquatolide MCD were made, and Strict Structure Generation [1,2] 14 was performed, which gave only three possible structures within 0.05 seconds (k=3, tg=0.05 s). These structures ranked along with their 13C average deviations dA, dN and dI are shown in Figure 2. The maximum 13C deviations are also given for each structure.
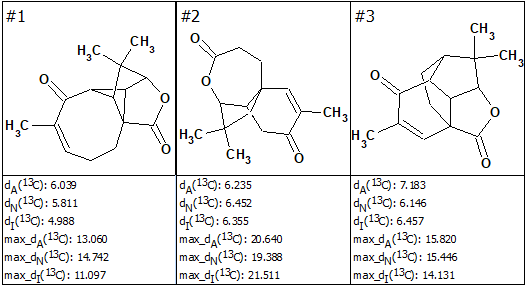
Figure 2. The candidate structures for aquatolide ranked with dA values. Notations of average deviations depending on a method of prediction: dA—HOSE code, dN—neural networks, dI—incremental approach. Here, the correct structure is first in the rank-ordered output list.
As seen from Figure 2, the first ranked structure #1 is identical to the revised structure 2, though all its average deviation values were significantly higher than those typically observed in similar analyses (dn < 3 ppm, n=A, N, I). This result is a consequence of the very unusual skeleton of 2 for which there is a lack of associated structures in the reference databases. It is interesting to note that if the empirical 13C chemical shift predictions were done for the originally proposed ladderane structure, 1, the structure would have been conclusively rejected due to a large max_dA value (26.5 ppm). In this case, the suggestion of an incorrect structural hypothesis would be prevented.
As seen in Figure 2 Structure Elucidator allowed the identification of the correct structure of aquatolide in a fully automatic way without detailed analysis of J-couplings in NMR spectra as it was performed in [7]. However, the preference of structure #1 over other structures displayed in Figure 2 is only slightly better when judged by the average 13C deviation values. Selection of the most probable structure #1 obviously needs a better confirmation, which prompted us to employ the QM calculations. It is noteworthy, that the QM calculations were only needed for three plausible molecules, rather than ~50 as in the study leading to the revision of the structure of aqutolide [7].
QM calculations of 13C chemical shifts were performed at the mPW1PW91/6-311+G(2d,p) level of theory on optimized geometries at the B3LYP/6-31+G(d,p) level. The summary of QM calculations for three possible structures of aquatolide determined by CASE study is shown in Table 2.
| Experimental | Structure #1 | Structure #2 | Structure #3 | |
| Labels | δC | δCcalc | δCcalc | δCcalc |
| C 1 | 84.2 | 83.28 | 87.38 | 85.33 |
| C 2 | 54.54 | 54.53 | 69.43 | 53.46 |
| C 3 | 62.83 | 63.17 | 54.56 | 45.07 |
| C 4 | 22.15 | 22.80 | 36.46 | 22.29 |
| C 5 | 28.63 | 30.69 | 33.12 | 32.50 |
| C 6 | 131.1 | 135.07 | 160.44 | 146.18 |
| C 7 | 135.08 | 137.29 | 132.61 | 138.82 |
| C 8 | 211.94 | 211.99 | 197.42 | 201.88 |
| C 9 | 54.45 | 54.97 | 55.04 | 49.13 |
| C 10 | 62.59 | 64.91 | 79.42 | 50.35 |
| C 11 | 41.86 | 44.91 | 48.70 | 48.82 |
| C 12 | 177.5 | 177.40 | 172.69 | 176.12 |
| C 13 | 22.22 | 22.94 | 13.69 | 16.92 |
| C 14 | 22.62 | 20.63 | 19.75 | 18.37 |
| C 15 | 22.84 | 20.89 | 25.47 | 27.87 |
| RMSD, ppm | 1.82 | 11.38 | 7.65 | |
| max_d, ppm | 3.97 | 29.34 | 17.76 |
As is clear from the data presented in Table 2, the DFT-predicted 13C chemical shifts unequivocally define structure #1 (2) as the most probable among the three candidate structures. Thus, the root-mean-square deviation (RMSD) and maximum deviation of 13C chemical shifts for structure #1 were 1.82 and 3.97 ppm, respectively. These values are more than four-times smaller than those of the closest second structure #3, 7.65 and 17.76 ppm, respectively.
For completeness of the investigation, it was interesting to learn why the original structure 1 was not generated by the Structure Elucidator program. The structure of 1 was re-checked by the program using HMBC data, and it was found that it had three 4JHC “nonstandard” correlations. Because all HMBC correlations were assumed to be of a “standard” 3-bond length, the structure of 1 could not be generated in the Strict Generation mode. To generate this structure along with the correct one, the Fuzzy Structure Generation mode [1,2] should be used. This mode provided within the ACD/Structure Elucidator allows solving a problem even if an unknown number of “non-standard” correlations of “non-standard” length are present in the 2D NMR data.
Recently, aquatolide appeared in another method development study. Pauli and co-workers[8] have shown that the exhaustive extraction of information carried by chemical shifts and scalar coupling constants in the 800 MHz 1H NMR spectrum combined with QM prediction of these parameters and spectrum simulation confidently confirmed the validity of the revised structure 2 over the original structure, 1. The full analysis of proton NMR spectra was indeed a very popular tool until the late 80’s when it fell out of favor with the development of modern 2D NMR spectroscopy, high-field magnets and high-sensitivity NMR probes. The progress of NMR spectroscopy over the last three decades significantly expanded the scope of available and structurally relevant NMR parameters. Some of the data now routinely available includes heteronuclear couplings and chemical shifts, homo and heteronuclear NOE’s, carbon-carbon correlation experiments at natural abundance and even anisotropic NMR parameters like residual dipolar couplings (RDCs) and residual chemical shift anisotropy (RCSAs). In turn, the availability of these data has led to the development of new structure elucidation protocols that are more robust and possess higher predictive and diagnostic power than those based on proton NMR spectroscopy alone. In our experience, proton NMR data can be used for structure verification, but are less applicable for de novo structure elucidation. For instance, ACD/Structure Elucidator calculations showed that the number of aquatolide structural isomers that can be constructed, if rather obvious C=O (211.94 ppm) and O-C=O (177.5 ppm) fragments were added manually to MCD (Figure 1) and all HMBC connectivities were omitted, was about 9×10⁹. Therefore, it is practically impossible to discriminate these structures based on proton NMR data alone. Second, a proton-centric method cannot be applied to proton-deficient molecules. In combination, these two factors significantly limit the scope of application of 1D proton NMR spectroscopy for structure elucidation of natural products. The amount of structural information carried by heteronuclear 2D NMR spectroscopy is significantly greater than that contained in 1D 1H NMR spectra, and the extraction of structurally relevant information from 2D NMR data is often much easier in comparison with the full analysis of a complex 1H NMR spectrum. Hence, it is difficult to conceive that a 1H spectra analysis alone will be used widely as the primary basis for structure elucidations, while 2D NMR data will serve only for structure confirmation as commented by Pauli and co-workers[8].
In summary, the example shows that the method proposed in [3,4] is not only efficient, but is also more general and can be applied to the verification or de novo determination of molecular structures.
References
- Elyashberg, M. E.; Williams, A. J.; Blinov, K. A. Contemporary Computer-Assisted Approaches to Molecular Structure Elucidation; RSC, Cambridge, 2012.
- Elyashberg, M. E.; Williams, A. J. Computer-based Structure Elucidation from Spectral Data. The Art of Solving Problems; Springer, Heidelberg, 2015.
- Buevich, A. V.; Elyashberg, M. E. (2016). Synergistic combination of CASE algorithms and DFT chemical shift predictions: a powerful approach for structure elucidation, verification and revision. J. Nat. Prod., 79(12): 3105–3116.
- Buevich, A. V.; Elyashberg, M. E. (2018). Towards unbiased and more versatile NMR-based structure elucidation: A powerful combination of CASE algorithms and DFT calculations. Magn. Reson. Chem. DOI: 10.1002/mrc.4645
- Elyashberg, M. E.; Blinov, K. A.; Smurnyy, Y. D.; Churanova, T. S.; Williams, A. J. (2010). Empirical and DFT GIAO quantum-mechanical methods of (13)C chemical shifts prediction: competitors or collaborators? Magn. Reson. Chem., 48: 219–229.
- San Feliciano, A.; Medarde, M.; Miguel del Corral, J. M.; Aramburu, A.; Gordaliza, M.; Barrero, A. F. Tetrahedron Lett. 1989, 30, 2851.
- Lodewyk, M.W.; Soldi, C.; Jones, P.B.; Olmstead, M. M.; Rita, J.; Shaw, J. T.;Tantillo, D. J. (2012). The Correct Structure of Aquatolide – Experimental Validation of a Theoretically-Predicted Structural Revision. J. Am. Chem. Soc., 134: 18550–18553.
- Pauli, G. F.; Niemitz, M.; Bisson, J.; Lodewyk, M. W.; Soldi, C.; Shaw, J. T.; Tantillo, D. J.; Saya, J. M.; Vos, K.; Kleinnijenhuis, R. A.; Hiemstra, H.; Chen, S.-N.; McAlpine, J. B. ; Lankin, D. C.; Friesen, J. B. J. (2016). Toward Structural Correctness: Aquatolide and the Importance of 1D Proton NMR FID Archiving. Org. Chem., 81: 878—889.
About the Author