June 1, 2016
by Mikhail Elyashberg, Leading Researcher, ACD/Labs
Astellifadiene
The last decade witnessed an unprecedented accumulation of genome sequences from many microorganisms. The availability of these genomic data has allowed not only the rapid identification of biosynthetic genes for known compounds, but also the genome-based discovery of new natural products [1].
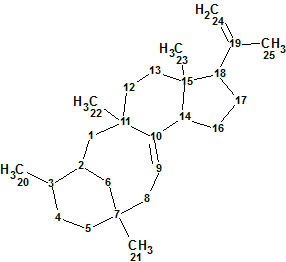
Matsuda et al. [1] focused on Emericella variecolor NBRC 32302 as a potential source of terpene synthase genes. The authors reported the production and structure characterization of the novel sesterterpene Astellifadiene (1). Analysis of the 1H-1H COSY, HMBC, and NOESY correlations established the planar structure of 1 as an unprecedented 6-8-6-5-membered tetracyclic ring system. The use of NMR analyses combined with the crystalline sponge method facilitated the unambiguous determination of the Astellifadiene structure.

1
This combination of methods was utilized because the structure determination of complex terpenoids is often difficult with only conventional methodologies, particularly when the oxidation level of the terpenoid is low [1]. The molecular formula of 1 was established as C25H40 by HR-MS, thus indicating six degrees of unsaturation. The 13C NMR spectrum revealed 25 signals including four olefinic carbon atoms, thus suggesting a tetracyclic backbone for 1.
To challenge ACD/Structure Elucidator Suite, the NMR spectroscopic data presented in Table 1 were used. Note that the COSY data are omitted in Table 1 as superfluous, due to the rich HMBC spectrum.
Table 1. NMR spectroscopic data (in CDCl3) for Astellifadiene.
| C label | δC | δC*calc | XHn | δH | C HMBC |
| C 1 | 39.3 | 36.15 | CH2 | 2.11 | C 3, C 11, C 12 |
| C 1 | 39.3 | 36.15 | CH2 | 1.14 | C 2, C 6, C 10, C 11, C 22 |
| C 2 | 34.8 | 35.05 | CH | 1.89 | C 7 |
| C 3 | 36.3 | 39.58 | CH | 1.59 | |
| C 4 | 26.2 | 28.87 | CH2 | 1.50 | |
| C 4 | 26.2 | 28.87 | CH2 | 1.32 | |
| C 5 | 39.3 | 35.28 | CH2 | 1.37 | |
| C 5 | 39.3 | 35.28 | CH2 | 1.26 | C 4, C 6, C 7, C 21 |
| C 6 | 38.4 | 35.39 | CH2 | 0.84 | |
| C 6 | 38.4 | 35.39 | CH2 | 2.04 | |
| C 7 | 33.3 | 33.51 | C | ||
| C 8 | 36 | 46.56 | CH2 | 1.34 | C 6, C 7, C 9, C 10, C 21 |
| C 8 | 36 | 46.56 | CH2 | 2.76 | C 7, C 9, C 10, C 21 |
| C 9 | 117.8 | 121.6 | CH | 5.07 | C 7, C 8, C 11, C 14 |
| C 10 | 144.7 | 144.85 | C | ||
| C 11 | 41.7 | 35.92 | C | ||
| C 12 | 34.1 | 37.15 | CH2 | 0.95 | C 10, C 11, C 15 |
| C 12 | 34.1 | 37.15 | CH2 | 2.03 | |
| C 13 | 36.4 | 32.28 | CH2 | 1.63 | |
| C 13 | 36.4 | 32.28 | CH2 | 1.59 | C 11, C 12, C 14, C 15, C 23 |
| C 14 | 52.7 | 51.02 | CH | 2.34 | C 9, C 10, C 11, C 18, C 23 |
| C 15 | 44.6 | 43.28 | C | ||
| C 16 | 39.5 | 39.12 | CH2 | 1.50 | |
| C 16 | 39.5 | 39.12 | CH2 | 1.35 | |
| C 17 | 28.9 | 30.12 | CH2 | 1.44 | C 15, C 19 |
| C 17 | 28.9 | 30.12 | CH2 | 2.01 | C 14, C 15 |
| C 18 | 45.2 | 51.37 | CH | 2.6 | C 14, C 17, C 19, C 24, C 25 |
| C 19 | 148.6 | 147.91 | C | ||
| C 20 | 19.6 | 19.01 | CH3 | 0.85 | C 2, C 4 |
| C 21 | 30.6 | 26.79 | CH3 | 0.74 | C 6, C 7, C 8 |
| C 22 | 30.1 | 28.17 | CH3 | 1.18 | C 10, C 11, C 12 |
| C 23 | 19.1 | 24.58 | CH3 | 0.82 | C 13, C 14, C 15 |
| C 24 | 109.2 | 109.04 | CH2 | 4.67 | C 18, C 19, C 25 |
| C 25 | 19.8 | 19.46 | CH3 | 1.66 | C 18, C 19, C 24 |
* 13C chemical shift calculations were carried out using a HOSE code based approach [2]
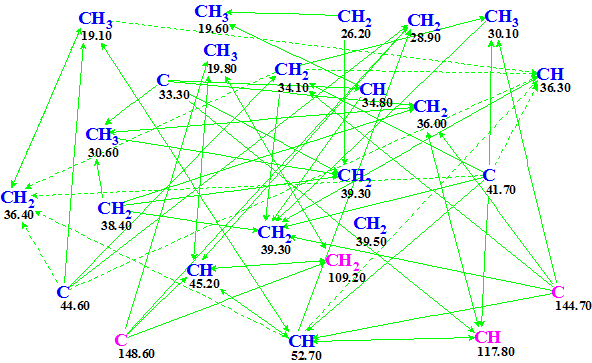
Figure 1 shows a Molecular Connectivity Diagram (MCD) produced by the software from the data collected in Table 1.

Figure 1. Molecular Connectivity Diagram for Astellifadiene.
MCD overview. Figure 1 shows that the software automatically set hybridizations for all carbon atoms (sp3–blue, sp2–violet). HMBC connectivities make up a dense net which encompass all carbons except one—CH2 39.50. As the 13C and 1H spectra contain overlapping signals (marked by underlined italics in Table 1), we know some ambiguous connectivities are present in the MCD (marked by dotted lines in the MCD). No edits of the MCD were made. Checking for the presence of contradictions in the HMBC data showed that data were fully consistent, so strict structure generation [2] was initiated. Structure generation was completed in 0.03 s with the following results: k = 18 → 16 → 10, tg = 0.03 s.
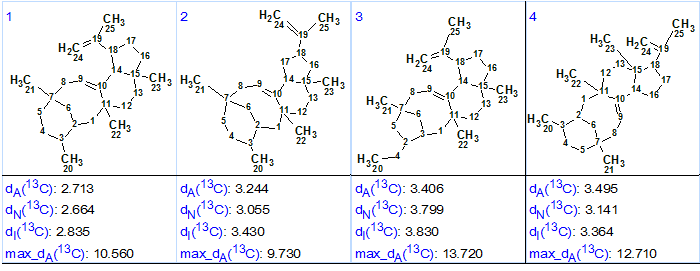
As per our normal methodology with Structure Elucidator, 13C chemical shift prediction was performed for the ten structures of the output file by three empirical methods—HOSE code-based, neural networks and incremental approach [2] for which average chemical shift deviations dA, dN and dI correspondingly were calculated. Then the structures were ranked in increasing order of dA values. The four top ranked structures are presented in Figure 2.

Figure 2. Four top ranked structures of the output file for Astellifadiene.
Comparison of the first ranked structure #1 with that determined by authors [1] shows that both structures are identical. The priority of structure # 1 is confirmed by average deviations computed by all three methods. The other competing structures are rather similar to the structure #1, but they are characterized by larger deviations. As mentioned above, structure 1 was confirmed by crystalline sponge method which also allowed the absolute configuration of Astellifadiene to be determined. The crystalline sponge method is an X-ray technique which enables the crystallographic analysis of even oily compounds in minute quantities, and it can be used in the determinations of the absolute structures of natural products and their derivatives [3].
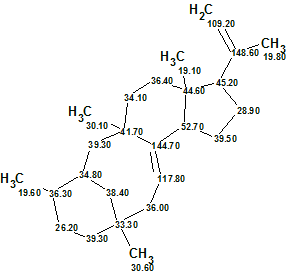
The elucidated structure of Astellifadiene along with 13C chemical shift assignments automatically performed by the program is shown below:

1a
Thus, the structure containing unprecedented 6-8-6-5-membered tetracyclic ring system was determined fully automatically in no time using ACD/Structure Elucidator Suite.
References
- Y. Matsuda, T. Mitsuhashi, S. Lee, M. Hoshino, T. Mori, M. Okada, H. Zhang, F. Hayashi, M. Fujita, I. Abe. (2016). Astellifadiene: Structure Determination by NMR Spectroscopy and Crystalline Sponge Method, and Elucidation of its Biosynthesis. Angew. Chem. Int. Ed., 55:5785–5788.
- M.E. Elyashberg, A.J. Williams. (2015). Computer-based Structure Elucidation from Spectral Data (p. 454). Springer-Verlag Berlin, Heidelberg.
- Y. Inokuma, S. Yoshioka, J. Ariyoshi, T. Arai, Y. Hitora, K. Takada, S. Matsunaga, K. Rissanen, M. Fujita. (2013). X-ray analysis on the nanogram to microgram scale using porous complexes. Nature, 495:461–466.


