December 1, 2015
by Mikhail Elyashberg, Leading Researcher, ACD/Labs
Callyspongiolide
Macrolides have been reported from various marine macroorganisms, but are especially prominent for marine sponges. Many macrolides display potent anti-proliferative properties against cancer cells, making them promising leads for the development of new chemo-therapeutic agents. Due to their unusual structures and pronounced bioactivity, these compounds continue to be exciting targets for realizing a total synthesis.
Sponges belonging to the genus Callyspongia have proven to be rich sources of various cytotoxic substances, such as polyketides, polyacetylenes, alkaloids, and cyclic peptides.
Macrolides, however, have not been reported from this genus prior to the study published recently by C.-D. Pham et al [1] who described the structure elucidation, configurational analysis, and cytotoxic activity of the first macrolide discovered from the genus Callyspongia, named Callyspongiolide (Structure 1).
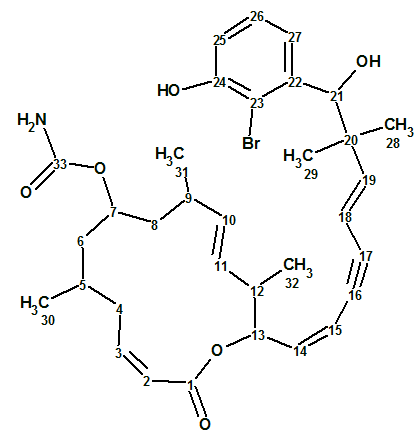
Structure 1
This macrolide features a conjugated diene-ynic side chain ending at a brominated benzene ring, which is unprecedented among all marine macrolides reported so far [1].
Callyspongiolide was obtained as a light yellowish amorphous solid. The ESIMS spectrum of 1 showed pseudo-molecular ion peaks ([M + Na]+) at m/z 650 and 652 with approximately the same intensity, indicating the presence of one bromine atom. Its molecular formula was established as C33H42BrNO6 by HRESIMS measurement, as a prominent pseudo-molecular ion peak was observed at m/z 650.2085 [M + Na]+.
To elucidate the structure of Callyspongiolide, 13C, 1H, HSQC, HMBC and COSY spectra were used in the original work [1]. To determine if ACD/Structure Elucidator Suite was able to reproduce this result, these data, along with molecular formula of the compound were input into the software (see Table 1).
Table 1. NMR spectroscopic data for Callyspongiolid.
| Label | δC | δC calc | XHn | δH | COSY | C HMBC |
| C 1 | 164.2 | 168.25 | C | |||
| C 2 | 122.3 | 123.93 | CH | 5.93 | 6.13 | C 1, C 4 |
| C 3 | 142.5 | 147.21 | CH | 6.13 | 3.41, 5.93 | C 1, C 5 |
| C 4 | 31.3 | 37.64 | CH2 | 3.41 | 1.75, 6.13 | C 2, C 3, C 5, C 30 |
| C 5 | 26.9 | 26.77 | CH | 1.75 | 0.97, 1.37, 3.41 | |
| C 6 | 41.1 | 43.02 | CH2 | 1.37 | 1.75, 4.47 | |
| C 6 | 41.1 | 43.02 | CH2 | 1.01 | ||
| C 7 | 68.3 | 72.13 | CH | 4.47 | 1.37, 1.41 | C 5, C 6, C 8, C 9, C 33 |
| C 8 | 44.1 | 41.92 | CH2 | 1.41 | 2.00, 4.47 | |
| C 8 | 44.1 | 41.92 | CH2 | 1.03 | ||
| C 9 | 33.2 | 33.21 | CH | 2 | 0.87, 1.41, 5.06 | C 10, C 11, C 31 |
| C 10 | 136.4 | 138.47 | CH | 5.06 | 2.00, 5.22 | C 9, C 11, C 12, C 31 |
| C 11 | 132 | 130.47 | CH | 5.22 | 2.24, 5.06 | C 9, C 10, C 12, C 13, C 32 |
| C 12 | 41.8 | 41.41 | CH | 2.24 | 0.89, 5.09, 5.22 | C 10, C 11, C 13, C 14, C 32 |
| C 13 | 75.7 | 70.85 | CH | 5.09 | 2.24, 6.06 | C 1, C 11, C 12, C 14, C 15 |
| C 14 | 139.6 | 139.64 | CH | 6.06 | 5.09, 5.94 | C 12, C 13, C 15, C 16 |
| C 15 | 113.4 | 112.21 | CH | 5.94 | 5.46, 6.06 | C 13, C 14, C 17 |
| C 16 | 86.3 | 91.18 | C | |||
| C 17 | 90.4 | 92.77 | C | |||
| C 18 | 106.8 | 110.07 | CH | 5.46 | 5.94, 6.36 | C 14, C 15, C 16, C 17, C 19, C 20 |
| C 19 | 151.6 | 152.92 | CH | 6.36 | 5.46 | C 16, C 17, C 18, C 20, C 21, C 28, C 29 |
| C 20 | 43 | 46.64 | C | |||
| C 21 | 76.5 | 79.78 | CH | 4.89 | C 19, C 20, C 22, C 23, C 27, C 28, C 29 | |
| C 22 | 143.2 | 142.09 | C | |||
| C 23 | 111.7 | 113.61 | C | |||
| C 24 | 153.3 | 155.55 | C | |||
| C 25 | 114.3 | 116.29 | CH | 6.83 | 7.13 | C 23, C 24, C 27 |
| C 26 | 126.9 | 127.55 | CH | 7.13 | 6.83, 6.84 | C 22, C 23, C 24, C 25, C 27 |
| C 27 | 120.1 | 121.5 | CH | 6.84 | 7.13 | C 21, C 23, C 25 |
| C 28 | 24.1 | 24.09 | CH3 | 1.04 | C 19, C 20, C 21, C 29 | |
| C 29 | 22.4 | 22.77 | CH3 | 0.96 | C 19, C 20, C 21, C 28 | |
| C 30 | 19.9 | 19.91 | CH3 | 0.97 | 1.75 | C 4, C 5, C 6 |
| C 31 | 22 | 21.91 | CH3 | 0.87 | 2 | C 8, C 9, C 10 |
| C 32 | 17.4 | 16.37 | CH3 | 0.89 | 2.24 | C 11, C 12, C 13 |
| C 33 | 156.7 | 157.84 | C | |||
| O 1 | 100* | OH | 5.49 | C 20, C 21, C 22 | ||
| O 2 | 150* | OH | 10.04 | C 23, C 24, C 25 |
* Fictitious chemical shifts of 17O were introduced to allow usage of 2D NMR correlations involving OH groups.
A Molecular Connectivity Diagram (MCD) was produced by the program from the data presented in Table 1. In the dialog window “Create MCD options”, the presence of carbon atoms in any hybridization (sp3, sp2, sp) was allowed. Though an IR spectrum of Structure 1contains a weak absorption band at ~2200 cm-1 characteristic for the triple bond (Figure 1), it cannot be considered as the evidence of alkyne group because the peak could be accounted for by an overtone or a combined frequency.
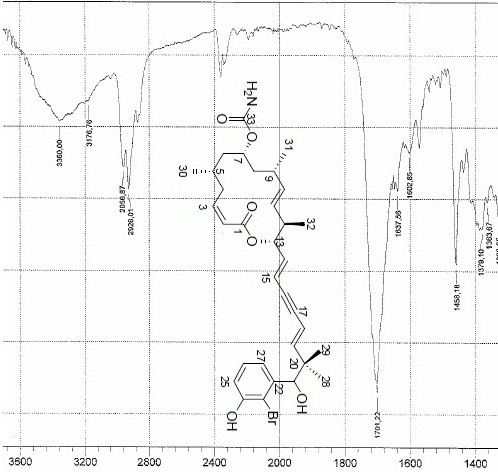
Figure 1. A high frequency area of the IR spectrum for Callyspongiolid.
The Molecular Connectivity Diagram is presented in Figure 2.
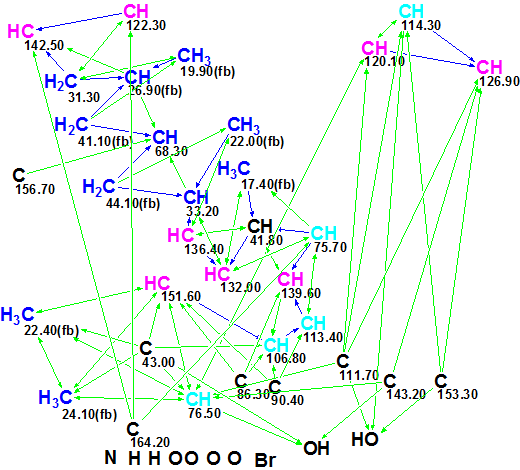
Figure 2. Molecular Connectivity Diagram for Callyspongiolid.
MCD overview. Figure 2 shows that there are five light blue carbon atoms whose hybridization is set by the program as sp3 or sp2 and eight black carbons for which hybridization and possibility of connection to a heteroatom was not defined. These uncertainties are accounted for by the assumption that a C≡C group may be present in the structure. In spite of this ambiguity in the initial data, no user MCD edits [postulated user assumptions or axioms [2] upon atom properties] were made.
Checking the MCD for 2D NMR data consistency, the program displayed the following message: “The minimum number of non-standard connectivities is 3”. This means that the combined HMBC and COSY data contain so called non-standard connectivities (NSCs) whose length exceeds common values (one C-C bond for COSY, and two skeletal bonds for HMBC). Therefore Fuzzy Structure Generation [2] (FSG) was initiated, in the “Determine Options Automatically” mode. 13C chemical shift calculation for the structures generated was performed during the FSG process, and structures for which an average chemical shift deviation exceeds 5 ppm were rejected by the Structure Filtering.
The results were: k = 1174 → 14, tg = 1 m 13 s (PC 2.6 MHz), 4 (from 73) connectivities have been extended during generation and 4065 (from 1088430 possible) connectivity combinations have been used. We see that FSG was completed when the number of NSCs was set equal to 4 (m=4) by the program. Only ~4% of possible connectivity combinations were really used during FSG: all useless combinations were rejected by the program as a result of automatic logical analysis of combined HMBC and COSY data.
13C chemical shift prediction was carried out for all 14 remaining structures using three calculation methods implemented in Structure Elucidator Suite. The structures were then ranked in ascending order of 13C average chemical shift deviations. Figure 3 shows the top six ranked structures.
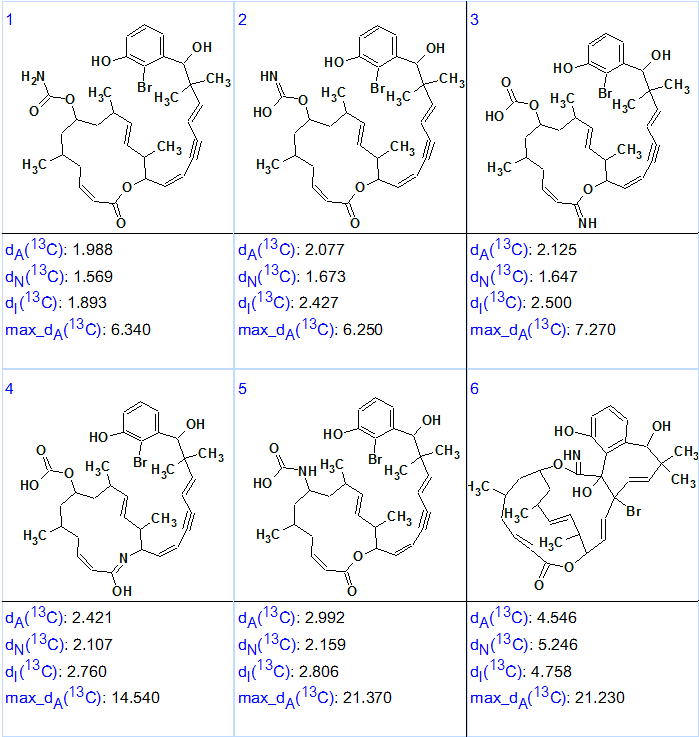
Figure 3. Six top ranked structures of the output file for Callyspongiolid.
Figure 3 shows that the first ranked structure (#1) is identical to the structure of Callyspongiolid determined in work [1]. The difference between average deviations calculated for structures 1–3 is small, but the priority of structure #1 is confirmed by the presence of the unusual fragment (O)(OH)C=NH in structure #2, while the remaining structures could be rejected by detailed analysis of IR spectrum. The structure 1 with automatically assigned 13C chemical shifts is shown below. Red arrows display NSCs detected during Fuzzy Structure Generation.
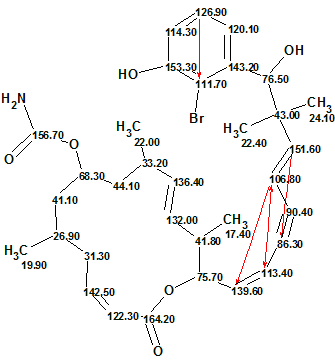
Structure 2
Note that the connectivity 113.4 → 106.8 is marked by a double-sided arrow, which denotes a COSY connectivity corresponding to a 5JHH type correlation. A HMBC 4JHC type correlation also exists between the same atoms, so the real number of NSCs in 2D NMR data is not four but five. This circumstance was taken into account by the software during the structure generation.
It was interesting to see what would happen if the user assumes that the molecule under investigation contains only sp3– and sp2-hybridized carbon atoms. The MCD was created with this option (sp-hybridized carbons were forbidden) and FSG was run twice – both with options set automatically, and with the condition that m=5. In both cases, exotic structures with large average (~5 ppm) and maximum (20–30 ppm) deviations were obtained, which proves the validity of our original solution. The three top ranked structures found as a result of this subsequent solution, run with automatically selected options, are shown in Figure 4.
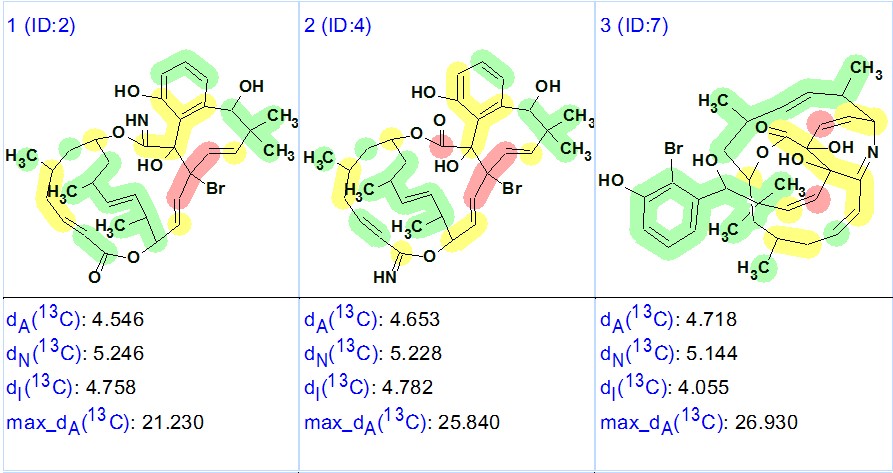
Figure 4. Three top ranked structures of the output file obtained under assumption that the molecule under investigation contains only sp3– and sp2-hybridized carbon atoms. Red circles denote the carbon atoms for which calculated 13C chemical shift deviations are larger than 15 ppm.
We were able to draw three conclusions from this example:
1. An unprecedented structure of a new macrolide was elucidated in fully automatic fashion using Fuzzy Structure Generation mode, without any user intervention and additional assumptions (axioms) in 1.3 min of PC processor time.
2. The problem was solved using HMBC and COSY data which contained 3 non-standard correlations of four bonds length (4J) and two correlations of 5J type. The true length of all NSCs were detected automatically by the software.
3. The presence of a C≡C group was determined automatically during the structure generation and then confirmed by checking solution for stability.
References
- C.-D. Pham, R. Hartmann, P. Böhler, B. Stork, S. Wesselborg, W. Lin, D. Lai, P. Proksch. (2014). Callyspongiolide, a Cytotoxic Macrolide from the Marine Sponge Callyspongia sp. Org. Lett., 16:266–269
- M.E. Elyashberg, A.J. Williams. (2015). Computer-based Structure Elucidation from Spectral Data (p. 454). Springer-Verlag Berlin, Heidelberg.
About the Author