October 1, 2016
by Mikhail Elyashberg, Leading Researcher, ACD/Labs
Ciliatonoid A
The genus Toona (Meliaceae family) is comprised of 15 species, mainly distributed in Asia and Africa. These woody plants are well-known for their applications in food and medicine and have attracted interest from the natural products related communities. This interest led to the isolation of a wide array of compounds, in particular, the limonoids with diverse biological activities. Toona ciliata Roem, a timber tree, is mainly found in the southern Provinces of China. Three new ring B-seco limonoids, ciliatonoids A-C, were isolated from an ethanolic extract of the twigs of T. ciliate by Liu and co-workers [1]. Structures of the new compounds, complete with absolute stereochemistry, were characterized by spectroscopic data, X-ray crystallography, and electronic circular dichroism (ECD) analysis.
To challenge ACD/Structure Elucidator Suite, Ciliatonoid A (1) was used. It featured an unprecedented limonoid architecture by way of a very unique cis-fused central motif (in red).
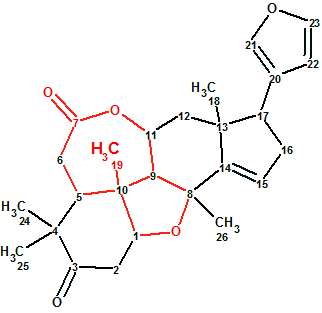
1
Ciliatonoid A (1), obtained as colorless crystals, possessed a molecular formula C26H32O5 as determined by HRESIMS at m/z 447.2141 [M + Na]+ (calculated 447.2147), requiring 11 degrees of unsaturation. The 13C NMR spectrum resolved 26 carbon resonances corresponding to 5 methyl, 4 methylene, 9 methine (four olefinic and two oxygenated), and 8 quaternary carbons.
The NMR spectroscopic data of Ciliatonoid A adopted from the original work [1] are presented in Table 1.
Table 1. NMR spectroscopic data for Ciliatonoid A.
| Label | δC | δC calc | XHn | δH | H Mult. | C HMBC |
| C 1 | 88.5 | 80.44 | CH | 4.24 | u | C 2, C 3, C 8 |
| C 2 | 44.3 | 42.29 | CH2 | 2.92 | u | |
| C 2 | 44.3 | 42.29 | CH2 | 2.98 | u | |
| C 3 | 212.9 | 213.38 | C | |||
| C 4 | 47.2 | 48.15 | C | |||
| C 5 | 42.8 | 45.31 | CH | 3.04 | u | C 6, C 7 |
| C 6 | 34.5 | 31.49 | CH2 | 3.1 | u | C 7 |
| C 6 | 34.5 | 31.49 | CH2 | 2.95 | u | |
| C 7 | 172.9 | 172.47 | C | |||
| C 8 | 83.6 | 84.55 | C | |||
| C 9 | 56.5 | 58.11 | CH | 2.95 | u | |
| C 10 | 44 | 44.51 | C | |||
| C 11 | 73.2 | 63.86 | CH | 4.9 | u | C 7, C 9, C 12 |
| C 12 | 40.4 | 40.34 | CH2 | 2.26 | u | |
| C 12 | 40.4 | 40.34 | CH2 | 2.12 | u | |
| C 13 | 50.8 | 47.73 | C | |||
| C 14 | 156.5 | 154.07 | C | |||
| C 15 | 122.2 | 124.25 | CH | 5.8 | u | C 14, C 16, C 17 |
| C 16 | 35.4 | 35.32 | CH2 | 2.61 | u | |
| C 16 | 35.4 | 35.32 | CH2 | 2.47 | u | |
| C 17 | 52.8 | 50.33 | CH | 2.89 | u | C 20, C 21, C 22 |
| C 18 | 24.9 | 21.99 | CH3 | 1.1 | S | C 12, C 13, C 14, C 17 |
| C 19 | 27.5 | 17.87 | CH3 | 1.24 | S | C 1, C 5, C 9, C 10 |
| C 20 | 123.8 | 125.9 | C | |||
| C 21 | 140.1 | 139.7 | CH | 7.27 | u | |
| C 22 | 110.6 | 111.14 | CH | 6.24 | u | C 21, C 23 |
| C 23 | 143.3 | 142.54 | CH | 7.4 | u | |
| C 24 | 28.4 | 23.25 | CH3 | 1.13 | S | C 3, C 4, C 5 |
| C 25 | 19.7 | 18.45 | CH3 | 1.2 | S | C 3, C 4, C 5 |
| C 26 | 29.4 | 18.57 | CH3 | 1.51 | S | C 8, C 9, C 14 |
The data were input into ACD/Structure Elucidator Suite, and a Molecular Connectivity Diagram (MCD) was created by the program (see Figure 1).
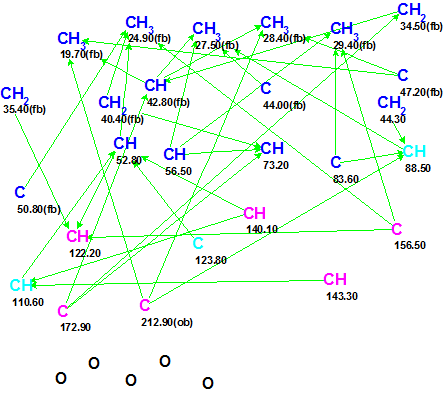
Figure 1. Molecular Connectivity Diagram (MCD) for Ciliatonoid A. The following colors are used to mark carbon atom hybridization: sp3—blue; sp2—violet; not sp (neither sp3 or sp2)—light blue. The symbols fb (forbidden) and ob (obligatory) denote the possible presence of a heteroatom as a neighbor.
No user edits of the automatically-created MCD were made, and structure generation accompanied by 13C chemical shift prediction was initiated. Structures for which average deviation exceeded 5 ppm were rejected by the program during structure generation.
The results were: k = 9→1, tg = 0.7 s, and the single structure obtained is presented in Figure 2.
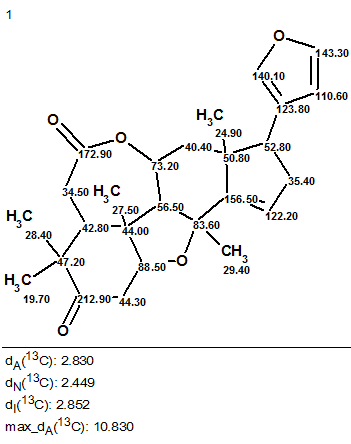
Figure 2. The single structure delivered by the program for Ciliatonoid A.
We see that the structure coincides with that derived by the authors [1]. The 13C chemical shift assignment shown on structure (Figure 2) is the same as that suggested by Liu and co-workers. The values of average 13C chemical shift deviations testify to the correctness of the answer. Thus, an unprecedented structure of a natural product was fully automatically and unambiguously elucidated by means of ACD/Structure Elucidator Suite nearly instantaneously (0.7 s).
References
- C.-P. Liu, G.-C. Wang, L.-S. Gan, C.-H. Xu, Q.-F. Liu, J. Ding, J.-M. Yue. (2016). Ciliatonoids A and B, Two Limonoids from Toona ciliata. Org. Lett., 18(12): 2894–2897.
- M.E. Elyashberg, A.J. Williams. (2015). Computer-based Structure Elucidation from Spectral Data (p. 454). Springer-Verlag Berlin, Heidelberg.
About the Author