January 1, 2013
by Mikhail Elyashberg, Leading Researcher, ACD/Labs
Geranylphenazinediol
Ohlendorf and co-workers1 describe isolation and structure elucidation of Geranylphenazinediol (Structure 1), a phenazinediol substituted with an isoprenoid side chain:
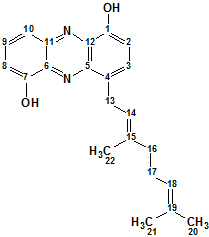
Structure 1
This new phenazine natural product was produced by the Streptomyces sp. strain LB173, which was isolated from a marine sediment sample. The structure was established by analysis of NMR and MS data. To identify the structure of new compound the authors used the known fact that the phenazine core structure has a characteristic UV spectrum, and substitution with hydroxyl groups leads to a bathochromic shift1. With UV maxima at 204, 273, 354, 374, and 458 nm, the UV spectrum of Structure 1 was almost identical to that of 1,6-phenazinediol. The molecular formula C22H24N2O2 was established by HR-ESI-MS, which was congruent with the NMR data. The 13C NMR spectrum comprised signals for 22 individual carbons. A common set of NMR data (1H, 13C, DEPT, 1H–13C HSQC, 1H–1H COSY, and 1H–13C HMBC) was employed for structure elucidation.
We used ACD/Structure Elucidator to elucidate structure of this new natural product using only its NMR spectroscopic data (13C, 1H, HSQC and HMBC), and assuming the a priory information (a similar structure of 1,6-phenazinediol with similar spectra) is unknown. The spectroscopic data inputted into Structure Elucidator are presented in Table 1.
Table 1. Geranylphenazinediol. NMR spectroscopic data.
| Label | δC | δC calc | XHn | δH | M(J) | COSY | HMBC |
| C 1 | 151.7 | 151.89 | C | ||||
| C 2 | 110.3 | 113.55 | CH | 7.17 | d(7.7) | 7.61 | C 12, C 5, C 1, C 4 |
| C 3 | 130.4 | 130.12 | CH | 7.61 | d(7.7) | 4.05, 7.17 | C 2, C 5, C 1, C 13 |
| C 4 | 131.3 | 129.56 | C | ||||
| C 5 | 141.3 | 142.64 | C | ||||
| C 6 | 135.3 | 134.15 | C | ||||
| C 7 | 153.8 | 153.42 | C | ||||
| C 8 | 110.5 | 109.49 | CH | 7.25 | d(7.70 | 7.73, 7.82 | C 10, C 11, C 7, C 6 |
| C 9 | 132.4 | 131.39 | CH | 7.82 | dd(8.7;7.7) | 7.25, 7.73 | C 7, C 8, C 6, C 11 |
| C 10 | 120 | 119.38 | CH | 7.73 | d(8.90) | 7.25, 7.82 | C 7, C 6, C 9, C 8 |
| C 11 | 142.3 | 142.43 | C | ||||
| C 12 | 136.8 | 134.15 | C | ||||
| C 13 | 28.9 | 29.91 | CH2 | 4.05 | d(7.40 | 1.80, 2.10, 5.54, 7.61 | C 3, C 16, C 4, C 5, C 15, C 17, C 14, C 2 |
| C 14 | 123.9 | 122.48 | CH | 5.54 | u | 1.80, 2.10, 4.05 | C 13, C 16, C 22 |
| C 15 | 136.9 | 135.89 | C | ||||
| C 16 | 40.5 | 39.49 | CH2 | 2.1 | u | 2.13, 5.54, 4.05 | C 14, C 22, C 17, C 15, C 18 |
| C 17 | 27.3 | 26.5 | CH2 | 2.13 | u | 1.55, 1.59, 2.10, 5.10 | C 15, C 19, C 18, C 16 |
| C 18 | 125.1 | 124.4 | CH | 5.1 | u | 1.55, 1.59, 2.13 | C 21, C 20, C 17 |
| C 19 | 131.8 | 131.6 | C | ||||
| C 20 | 25.8 | 25.65 | CH3 | 1.59 | s | 2.13, 5.10 | C 18, C 19, C 21 |
| C 21 | 17.7 | 17.75 | CH3 | 1.55 | s | 2.13, 5.10 | C 19, C 20, C 18 |
| C 22 | 16.2 | 15.98 | CH3 | 1.8 | s | 4.05, 5.54 | C 14, C 16, C 15 |
| O 1 | 100* | OH | 9.01 | u | |||
| O 2 | 110* | OH | 9.2 | u |
* Fictitious values
The Molecular Connectivity Diagram (MCD) used for the structure generation is shown below:
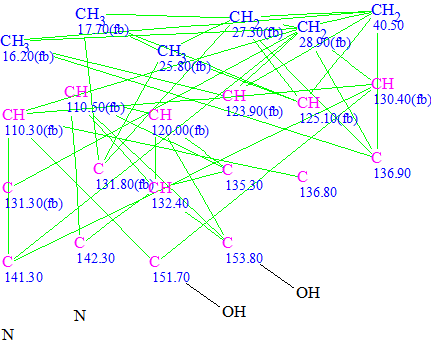
Figure 1. Geranylphenazinediol. Molecular connectivity diagram.
MCD Overview. Chemical shifts of two hydroxyl groups (9.01 and 9.20 ppm) were determined from the 1H NMR. The IR spectrum of Structure 1 was not given in the article1, but this assignment could be confirmed by IR spectrum as absorption bands of OH and NH groups are observed at different frequencies in a CCl4 solution2. The most downfield 13C chemical shifts 151.7 and 153.8 are typical for hydroxylated aromatic carbons, so it was assumed that OH groups can be connected with corresponding carbons by chemical bonds. These user constraints (“axioms”) significantly reduce the dimensions of the problem, as the program will not try to connect nitrogen atoms with the mentioned carbons. The numbers of hydrogen atoms n(H) attached to the neighboring carbon atoms were added to atom properties in accordance with 1H multiplicities shown in Table 1. It is known that chemical shifts of sp2 hybridized carbons connected with a nitrogen atom occur in rather wide interval of chemical shift values. The atom properties displayed in the MCD allow nitrogen atoms to be connected with any of the quaternary carbons in the chemical shift region of 135.3–142.3 ppm.
Checking the MCD for consistency resulted in detection of contradictions in the HMBC data, and the program highlighted that the minimum number of non-standard connectivities is 1. Further checking of Structure 1 with the assigned 13C chemical shifts allowed us to establish 7 non-standard connectivities, one of which is of 4 bonds length (5JCH), as shown on Structure 1a:
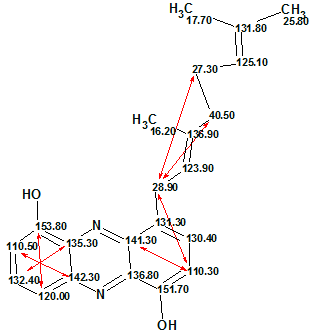
Structure 1a
To overcome contradictions in the HMBC data the Fuzzy Structure Generation (FSG) was initiated with following options:
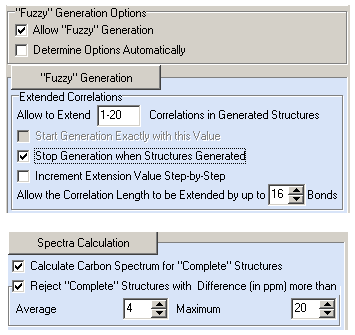
Figure 2. Geranylphenazinediol. Options of Fuzzy Structure Generation.
Figure 2 shows that FSG was run in the safest mode (m=1–20, a=16) when lengthening correlations is replaced with their deleting. FSG was stopped by the program when calculations with mg=6 were completed, that is attempts of structure generation with m=1–5 yielded zero structures. The result:
k = 324,660 → 132 → 31, tg = 7h 28m. Thus 2,142,400 from 4,496,388 possible combinations of connectivities were used for attempts to generate structures, which is a reason for the large structure generation time.
The beginning of the ranked output file is shown below (Figure 3) shows that the best structure having minimal deviations calculated by all three methods coincides with Structure 1.
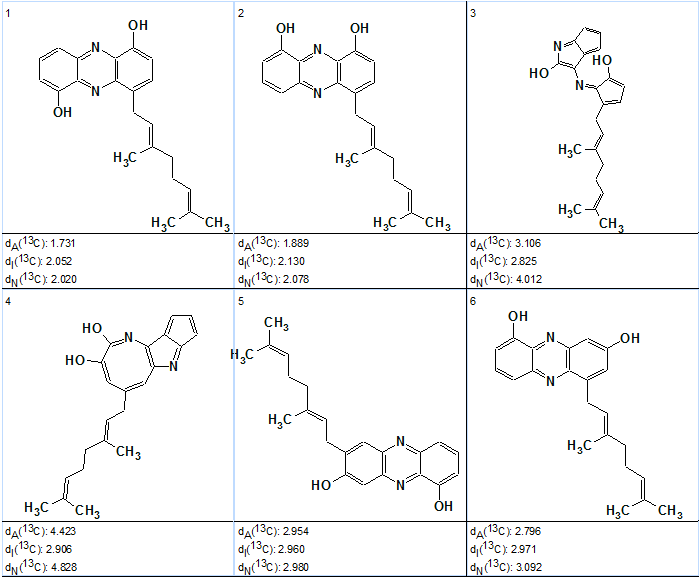
Figure 3. Geranylphenazinediol. Top structures of the ranked output file at mg=6.
It was interesting to find out why the correct solution was found at mg=6, while the number of NSCs is 7. The answer involves the comparison of shift assignments which were automatically performed for generated structure with assignments suggested by authors1:
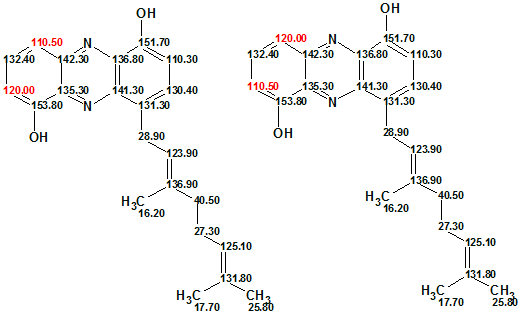
Figure 4: Automatic assignment (left), Manual assignment1 (right)
Automatic assignment placed the chemical shift 110.50 in the C 10 position, because the experimental 4JHC connectivity 110.5 to 142.3 (see Structure 1a) was not lengthened by the program at mg=6. Thus we obtained the correct structure, but with a pair of exchanged 13C chemical shifts.
The authors1 report, that “…the structure of 1 could be unequivocally proven with one exception: from the spectroscopic data it was impossible to discriminate between a 1,7-phenazinediol and a 1,10-phenazinediol core structure. The problem could be solved by NOESY correlations from the hydroxyl groups to methylene groups of the isoprenoid chains which were connected to the other aromatic ring. However, comparable NOESY correlations were not observed for 1. In order to determine the constitution, 1 was acetylated using pyridine-acetic anhydride, which yielded compound 2.
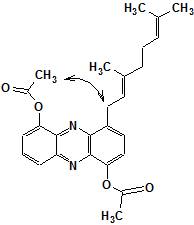
Structure 2
“As expected, two additional signals appeared in the 1H NMR spectrum accounting for one acetylmethyl group each. The respective NOESY spectrum showed no correlation of the two methyl signals to each other, but a correlation from one of the signals to CH2(28.9) of the isoprenoid side chain. Thus, we concluded the core structure to be 1,7-phenazinediol, a substitution pattern that is congruent with that of other naturally occurring phenazines.”
Figure 3 shows that the competing structure mentioned above could not be distinguished from the correct one without additional experiments, and is ranked as second. Therefore even the “approximate solution” found at mg=6 allowed the program to make a right choice between two most probable structures.
For the sake of completeness, we repeated Fuzzy Structure Generation with m=mg+1 = 7, i.e., the number of connectivities which will be deleted during the structure generation was set equal to 7. Result: k=26,616 → 45 → 23, tg =17h 38m. During the process of structure generation, 12,669,412 from 22,481,940 possible connectivity combinations were used for attempts to generate structures, which significantly increased the generation time. (Incidentally, the structure generation was performed using overnight program run similar to overnight 2D NMR spectrum acquiring—an approach common in NMR laboratories).
For comparison with the solution found at mg=6, the top of the last output file (for mg=6) is shown in Figure 5.
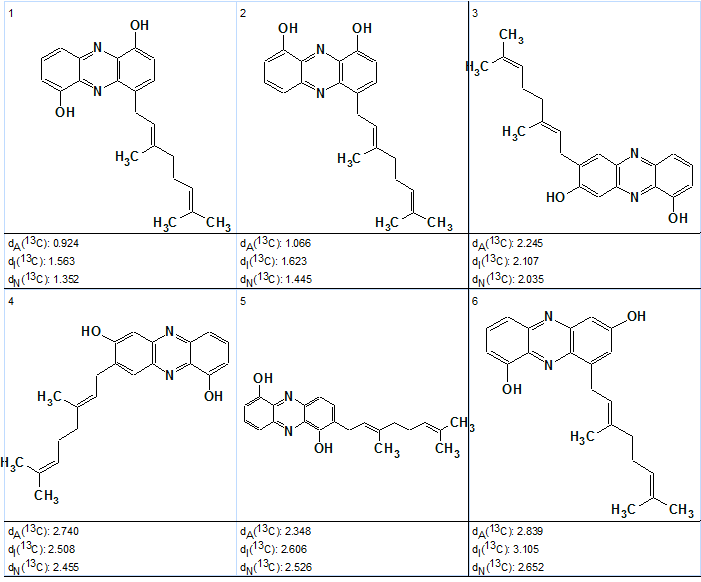
Figure 5. Geranylphenazinediol. Top structures of the ranked output file at mg =7.
Comparison of two solutions—”approximate” and “exact”—shows that all deviations calculated for the best (and correct) structure of the “exact” solution are significantly smaller than in the previous case, which is in agreement with the new (and correct) automatic chemical shift assignment. The competing structure is again ranked the second (#2), but its deviations are also smaller than in the “approximate” solution due to permuting the mentioned shifts 120 and 110.5 ppm.
The main goal of the molecular spectral analysis is to elucidate the structure of unknown compound. This example shows that even the “approximate” solution delivered the correct structure and ipso facto provided getting necessary answer.
References
- B. Ohlendorf, D. Schulz, A. Erhard, K. Nagel, J. F. Imhoff. Geranylphenazinediol, an Acetylcholinesterase Inhibitor Produced by a Streptomyces Species. J. Nat. Prod., 75 (7):1400–1404, 2012.
- E. Pretsch, P. Bühlmann, C. Affolter. Structure Determination of Organic Compounds-Tables of Spectral Data; Springer-Verlag: Berlin, 2000.
About the Author