June 1, 2015
by Mikhail Elyashberg, Leading Researcher, ACD/Labs
Garcimulin A
The famous Garcinia (Guttiferae) has attracted continuous attention in natural products chemistry, synthetic chemistry, and pharmacology. Numerous polycyclic polyprenylated acylphloroglucinols (PPAPs), xanthones, and flavonoids with highly complicated ring systems and broad array of biological activities have been reported from this genus. Garcinia multiflora Champ., a small evergreen tree, is found widely in the south of China. Its bark is commonly used topically to reduce inflammation.
Recently, Fan et al [1] isolated two PPAPs, Garcimulins A and B, including a pair of enantiomers [(+)-Garcimulin A and (-)-Garcimulin A )] with the unique caged tetracyclo[5.4.1.11,5.09,13]tridecane skeleton from the leaves and twigs of G. multiflora (Figure 1 and structure 1).
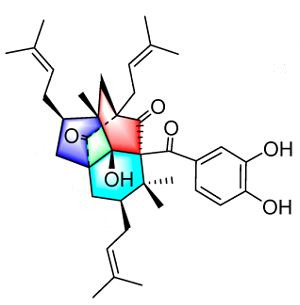
Garcimulin A was isolated as a light brown oil. A molecular formula of C38H50O6 is implied by the HR-EI-MS (m/z 602.3610 [M]+, calculated 602.3607), along with 1H and 13C NMR data with 14 degrees of unsaturation. The IR spectrum revealed the presence of a hydroxyl (3343 cm-1), at least two carbonyl groups (1735, 1704 cm-1), and an aromatic ring (1606 and 1450 cm-1). An absorption band at 1635 cm-1 is probably related to the stretching vibration of an olefin double bond (not to a carbonyl group as concluded in [1]).
The spectroscopic 1D and 2D NMR data used by the authors for structure elucidation of Garcimulin A [1] were input into ACD/Structure Elucidator Suite. The data are collected in Table 1. Note that only key HMBC and COSY correlations were presented in the article [1] in a graphical form.
Table 1: Garcimulin A. Spectroscopic NMR data.
| Label | δX | δC calc | XHn | δH | M(J) | COSY | C HMBC |
| C 1 | 70.2 | 70.02 | C | ||||
| C 2 | 205 | 207.15 | C | ||||
| C 3 | 68.5 | 67.4 | C | ||||
| C 4 | 212.2 | 211.16 | C | ||||
| C 5 | 61.1 | 59.96 | C | ||||
| C 6 | 84.9 | 88.18 | C | ||||
| C 7 | 204.3 | 194.51 | C | ||||
| C 8 | 133.2 | 129.84 | C | ||||
| C 9 | 118.6 | 116.8 | CH | 7.81 | u | C 11, C 7 | |
| C 10 | 146.8 | 146.19 | C | ||||
| C 11 | 152.2 | 151.69 | C | ||||
| C 12 | 115.2 | 114.41 | CH | 7.23 | u | 7.42 | C 8, C 10 |
| C 13 | 123.4 | 121.29 | CH | 7.42 | u | 7.23 | C 7 |
| C 14 | 26.8 | 30.56 | CH2 | 2.81 | u | C 3, C 4, C 2 | |
| C 14 | 26.8 | 30.56 | CH2 | 2.68 | u | 5.54 | |
| C 15 | 120 | 118.62 | CH | 5.54 | u | 2.68 | |
| C 16 | 134.4 | 135.84 | C | ||||
| C 17 | 26.2 | 25.9 | CH3 | 1.73 | u | C 15 | |
| C 18 | 18.1 | 17.95 | CH3 | 1.64 | u | C 15, C 17 | |
| C 19 | 38.8 | 38.45 | CH2 | 1.74 | u | ||
| C 19 | 38.8 | 38.45 | CH2 | 2.14 | u | 1.63 | C 5, C 4, C 6 |
| C 20 | 50.6 | 48.79 | CH | 1.63 | u | 2.26, 2.14 | C 22, C 6 |
| C 21 | 45.9 | 52.82 | C | ||||
| C 22 | 20.2 | 23.21 | CH3 | 1.22 | u | ||
| C 23 | 43.5 | 42.29 | CH2 | 2.21 | u | C 4, C 14, C 6 | |
| C 23 | 43.5 | 42.29 | CH2 | 1.79 | u | ||
| C 24 | 33.4 | 30.05 | CH2 | 2.26 | u | 1.63, 5.08 | C 20, C 19 |
| C 25 | 124.3 | 125.07 | CH | 5.08 | u | 2.26 | C 28, C 20 |
| C 26 | 131.8 | 132.99 | C | ||||
| C 27 | 25.9 | 25.83 | CH3 | 1.71 | u | C 28 | |
| C 28 | 18.2 | 18.01 | CH3 | 1.65 | u | ||
| C 29 | 32.1 | 37.43 | CH2 | 1.95 | u | ||
| C 29 | 32.1 | 37.43 | CH2 | 2.36 | u | 1.22 | C 6, C 5, C 31, C 19, C 4 |
| C 30 | 44 | 43.43 | CH | 1.22 | u | 1.78, 2.36 | C 23, C 21, C 6 |
| C 31 | 49.7 | 46.24 | C | ||||
| C 32 | 27.1 | 28.69 | CH3 | 1.45 | u | C 31, C 1, C 30 | |
| C 33 | 22 | 24.33 | CH3 | 1.53 | u | ||
| C 34 | 29.2 | 31.54 | CH2 | 1.78 | u | 4.97, 1.22 | |
| C 34 | 29.2 | 31.54 | CH2 | 2.12 | u | ||
| C 35 | 123.9 | 123.19 | CH | 4.97 | u | 1.78 | C 30 |
| C 36 | 132.9 | 132.52 | C | ||||
| C 37 | 25.8 | 26.04 | CH3 | 1.58 | u | C 35, C 38 | |
| C 38 | 17.9 | 18.02 | CH3 | 1.54 | u | C 35 | |
| O 1 | 100* | OH | 6.02 | u | C 6, C 1, C 5 |
*A fictitious 17O chemical shift.
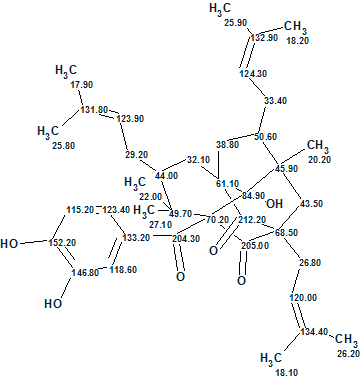
The Molecular Connectivity Diagram (MCD) created from Table 1 is shown in Figure 2.
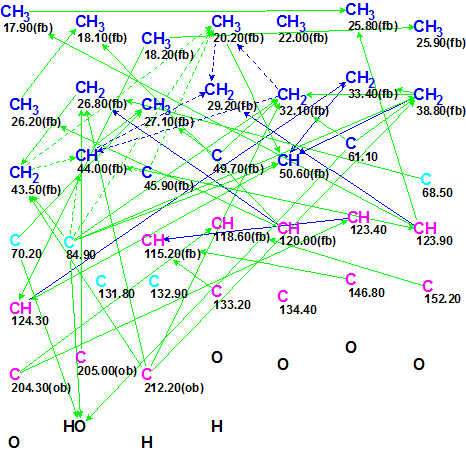
Figure 2. Molecular Connectivity Diagram for Garcimulin A.
MCD overview. The diagram contains five carbon atoms (colored in light blue) for which hybridization was set as “not sp” (sp3 or sp2). Carbon atoms C 22.00, C 131.8, C 132.9 and C 134.4 are free of any HMBC correlations. A series of ambiguous HMBC and COSY correlations (shown as dotted lines) account for the signal overlap at 1.22 ppm in 1H NMR spectrum. The presence of the mentioned ambiguities in spectroscopic data can hamper structure elucidation, but no edits were made to the MCD, and the process of structure generation was initiated.
Structure generation was accompanied with 13C chemical shift prediction using an approach based on additive rules. Structures for which average deviation d>4 ppm were rejected during structure filtering.
The results were: k = 18,948→90→9, tg = 4 m 55 s. 13C chemical shift prediction was carried out for the output file using the HOSE code based approach and neural networks, and then structures were ranked in increasing order of average deviation dA(13C) related to the HOSE code based prediction. The six top structures of the ranked file are presented in Figure 3.
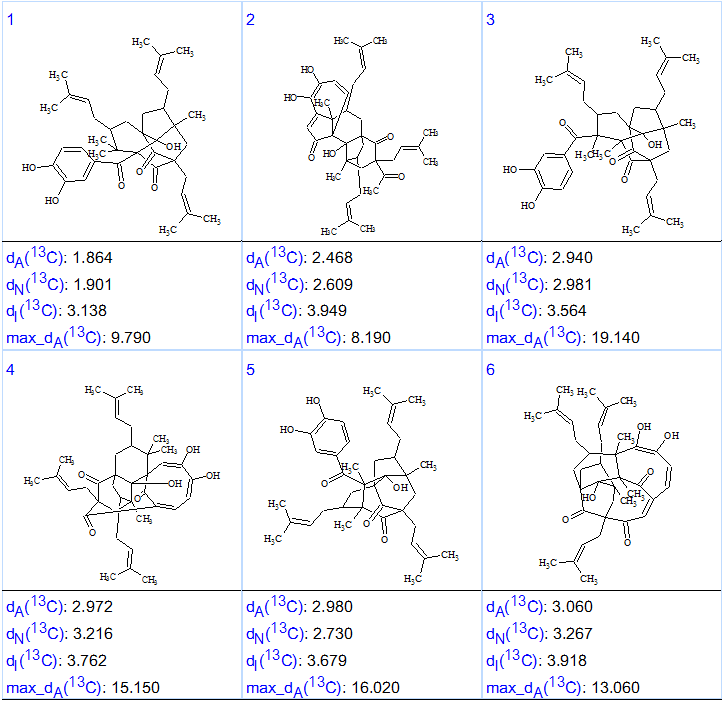
Figure 3. Six top structures of the ranked output file for Garcimulin A.
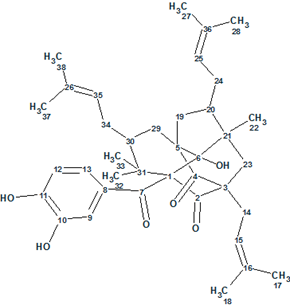
Figure 3 shows that the first ranked structure coincides with structure of Garcimulin A determined in article [1]. The elucidated structure with 13C chemical shift assignments set by the program is identical to that carried out by authors [1] is shown in Structure 2:
2
Therefore this example demonstrates how Structure Elucidator Suite can, in fully automatic fashion, determine the molecular structure of a complex natural product containing unique caged tetracyclo[5.4.1.11,5.09,13]tridecane skeleton from incomplete 2D NMR data in a short time (5 minutes). The dC calculations column of Table 1 demonstrates excellent coincidence between experimental and predicted 13C chemical shifts for this new natural product.
References
- Yi-Min Fan, et al. (2015). Two Unusual Polycyclic Polyprenylated Acylphloroglucinols, Including a Pair of Enantiomers. Garcinia multiflora. Org. Lett., 17:2066-69.
About the Author